Reimagining Transportation Procurement: Leveraging Data and Technology for Smarter Freight Decisions
December 12, 2024 / US
During tight freight markets, shippers bear the costs of spiking rates and frequent tender rejections. However, shippers can also play a major role in improving the efficiency of the freight network and boosting driver productivity. In particular, shippers’ collective efforts to improve the facilities experience can not only help retain drivers in the labor force but also improve their overall productivity. And that would subsequently lower the rates shippers pay.
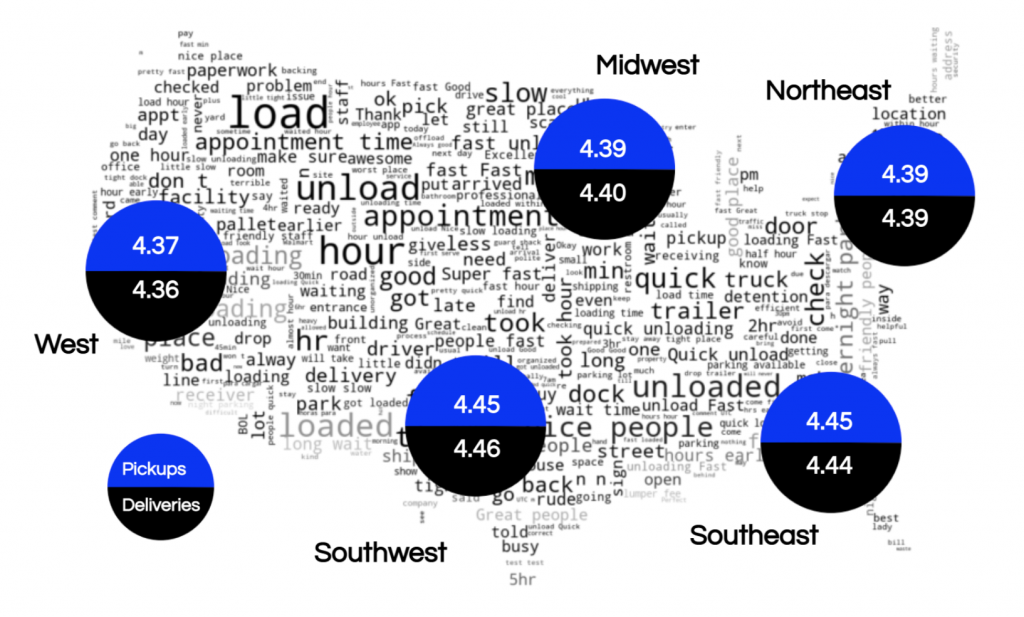
Uber Freight launched its facility rating feature in late 2018. Since then, we’ve collected more than 2.1 million ratings of 86,000 facilities in the US. In the following analysis, we present the main learnings from the 2021 facility ratings data, which provides valuable feedback to shippers in order to help them manage their facilities. In general, facility ratings improved compared with last year, especially in the Northeast, Southwest, and Midwest.
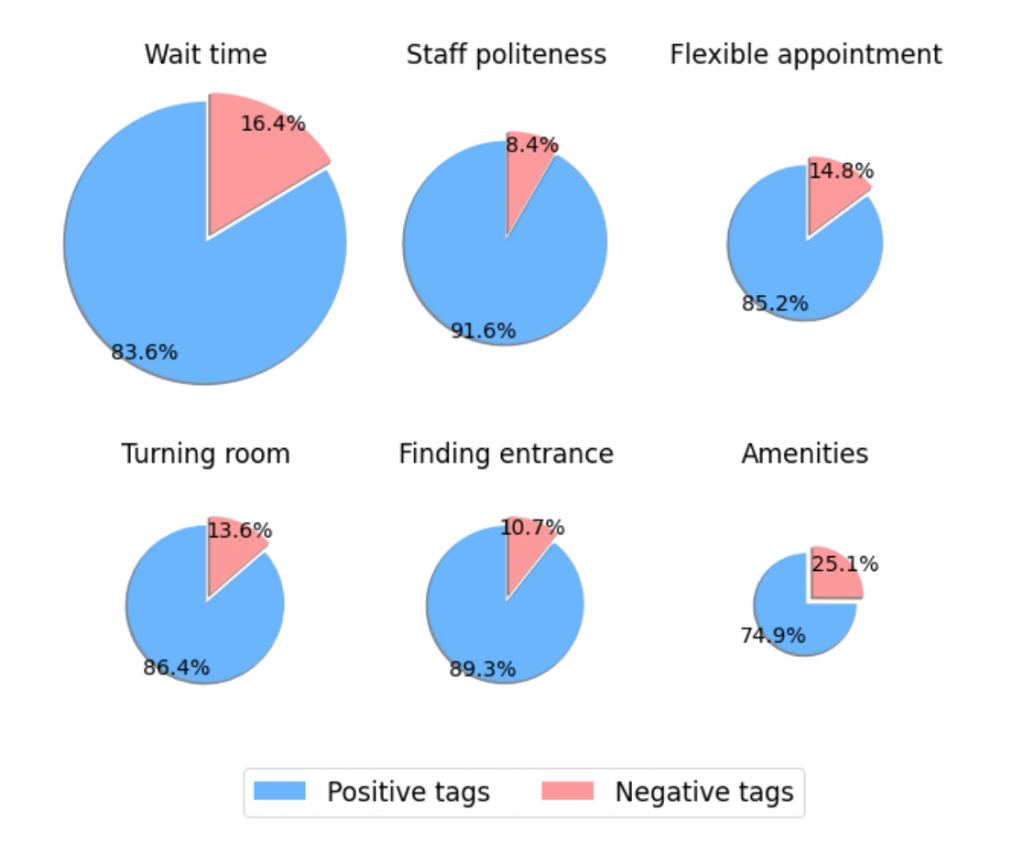
In addition to rating a facility on a scale of 1 to 5 stars, drivers provide feedback indicating what went well and what did not in 6 categories: wait time, amenities, flexible appointment, turning room, finding the entrance, and staff politeness. Figure 2 shows the split between positive and negative tags on each of these 6 dimensions. The size of each pie chart reflects the total number of tags (positive and negative) associated with that dimension.
Wait time was the most important factor to drivers, accounting for the largest portion of tags, followed by staff politeness. Staff politeness also had the smallest percentage of negative tags, indicating that drivers were mostly satisfied with their interactions with facility staff. On the other hand, amenities (such as restrooms) had the highest percentage of negative tags.
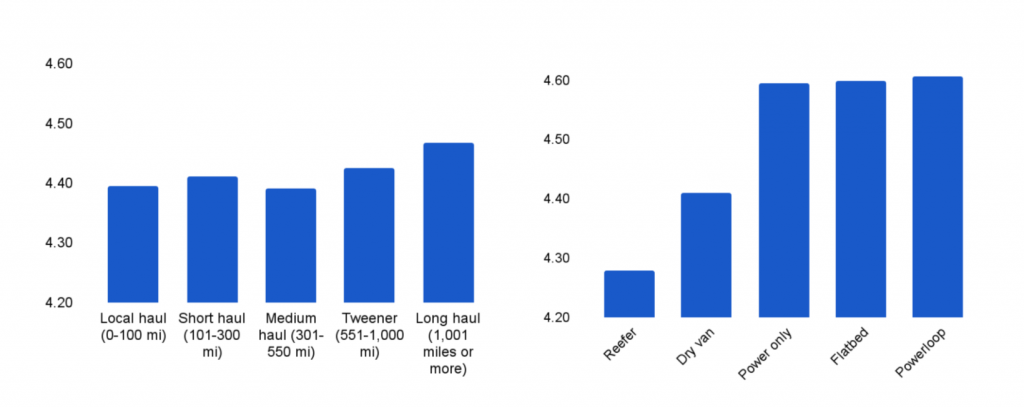
Facility scores increase with the length of haul, with long-haul trips having the highest ratings on average, as shown in Figure 3. In addition, ratings by trailer type were the highest for Powerloop loads and lowest for refrigerated loads. In general, ratings between pickups and deliveries had only minor differences. However, the value of waiting time seems more pronounced for pickups than deliveries.
Do these tags really matter for facility ratings?
To quantify the effect of different driver experiences on facility ratings, we used a statistical model to predict a driver’s satisfaction at a facility, and the subsequent rating. Drivers’ impressions on the above 6 dimensions were among the most important indicators of driver satisfaction.
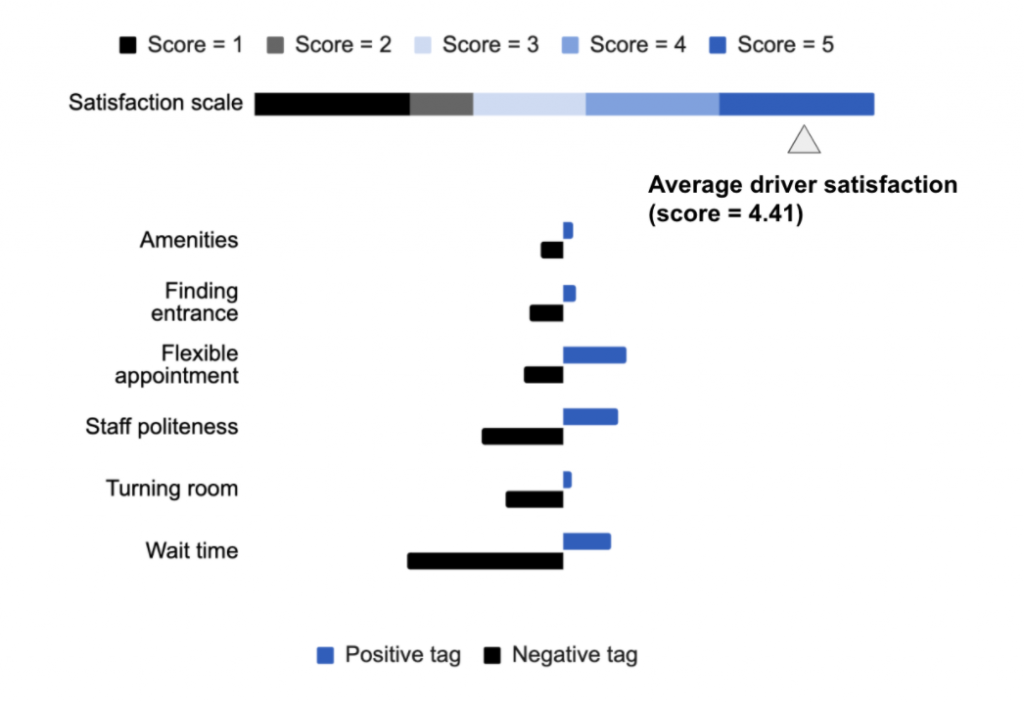
We estimated the driver satisfaction scale shown in the top part of Figure 4. Most drivers were satisfied at facilities, as shown by the average driver satisfaction (4.41) falling to the right end of the scale. The bottom part of Figure 4 shows the effect of various positive and negative tags on drivers’ satisfaction. The direction and magnitude of each bar indicate the predicted shift along the satisfaction scale.
These results show that a long waiting time can reduce a facility’s rating by 1 or 2 score points. The second-highest effect is associated with unpleasant interactions with facility staff. Although such interactions are infrequent (as shown in Figure 2), they can have detrimental effects on facility ratings when they occur (driver respect tops the list on Prof. Yossi Sheffi’s potential solutions to the driver shortage). Finally, drivers value appointment flexibility, which can save them substantial time that could otherwise be spent driving.
What about detentions and layovers?
Detentions occur frequently at facilities, resulting in unplanned delays that can reduce productivity and deter drivers. In our facility ratings data, about 7% of pickups and 8% of deliveries were associated with detentions. While the average facility rating was 4.41 across the board, ratings associated with detentions were substantially lower (3.51 for pickups and 3.47 for deliveries). By applying some reasonable assumptions, we find that a driver completing 4 hauls every week will experience on average 0.6 detentions per week, which can amount to about 3% of the driver’s time.
This might not sound like a lot, but 3% of supply hours is equivalent to adding 45,000 trucking jobs to the labor force, or about 15,000 long-distance truckload jobs. (Keep in mind that the ATA estimates the driver shortage at 80,000 jobs in 2021.) This is consistent with a study by Dr. David Correll from MIT’s Freight Lab, who found that drivers spend on average only about 6.5 hours a day driving out of 11 available hours and that an extra 12 minutes every day on the road per driver would end the shortage. Layovers happen less frequently (about 0.6% of loads in our ratings data were associated with a layover), but their impact can be as high.
In tight markets, drivers’ time is a scarce resource. Shippers, carriers, and brokers are all responsible for managing it wisely. Shippers can help on their end by:
Uber Freight will continue to monitor facilities performance and support shippers’ efforts to improve the experience for carriers.
1Assuming an average detention time of 2 hours, 4 loads per driver per week, and 8 hours of productive driver time per day.

With instant quotes, real-time tracking, and 24/7 access to trusted carriers, Uber helps streamline your operations.
With upfront pricing, instant booking, and facility ratings, Uber Freight puts you in the driver’s seat.