Reimagining Transportation Procurement: Leveraging Data and Technology for Smarter Freight Decisions
December 12, 2024 / US
As the US was recovering from winter storm Uri in March 2021, many consumers received their third stimulus check. That month, they spent 11% more on retail than they did in February. What followed was the largest increase in dry van spot rates, a staggering 27 cents per mile. A year later, the opposite happened. Truckload rates plunged by about 28 cents per mile, which was the largest drop on record.
After this sharp decline, many feared that a new wave of carrier bankruptcies might be upon us. Some even described it as a bloodbath. But are current spot rates that low? In the following sections, we look at how current rates compare to recent months and historical trends, and what is driving rates lower.
Our perceptions of the market softness in March are driven by recency bias. March rates seem low compared to January, but not if we zoom out further. With almost one million daily confirmed COVID cases, many drivers were sidelined in January, which resulted in historically high rates averaging $2.97 / mile. In March 2022, rates dropped by 37 cents from January’s peak, to $2.60. Since January was not a typical month, a fair comparison would be November 2021, just before the number of infections started rising. Back then, dry van rates were around $2.74 per mile, 14 cents higher than in March 2022.
This difference is not as or quite as large, especially when we consider seasonal effects. Rates are generally lower in Q1 than in Q4, and March rates are expected to be 4.5% below November.1 Therefore, November’s average rate of $2.74 in November 2021 would be equivalent to $2.62 in March 2022, which is only 2 cents per mile higher than what we saw.
In 2021, economic forces such as employment, consumer spending, and lockdowns were pushing rates up. In 2022, some of these forces are starting to pull rates down. Since May 2021, long-distance truckload carriers have hired more than 25k drivers. In addition, new carriers continued to flood the market, as FMCSA issued more than 176,000 operating authorities since July 2020.2 However, many of these were already working for larger carriers, and did not result in additional capacity. In addition, several inflationary pressures remain in place. For example, real retail sales (i.e., adjusted for inflation) are still at the elevated levels observed throughout 2021, and manufacturing is still growing.
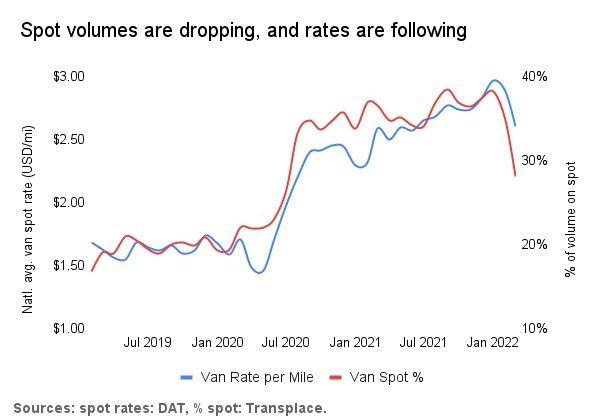
Although some economic factors might bring trucking rates lower, they cannot explain the steep decline we saw in March. In addition to supply recovery from Omicron, this was mostly driven by spot volumes moving under new contracts. For the past two years, spot rates have been mostly above contract rates. As a result, carriers rejected more than 20% of the tendered loads in 2021.3 With the start of the new RFP season in 2022, shippers took aggressive actions to control the predictability of their supply chains. They locked in new contract rates that were 18% higher than the ones being replaced.4 The majority of these contracts went online in Q1, which took a lot of volume off the spot market. Transplace Data Insights shows that the percentage of spot volume has decreased from 38% in January to 28% in March.5
Technology has a critical role to play in absorbing the shock of these market changes and helping shippers and carriers, of all sizes, ride out the waves of market volatility.
For shippers, it’s critical to leverage leading-edge technology and domain expertise that unlocks transparent – and fast – capacity with rates in real-time. Tools like Market Access and Transplace’s Logistics Solutions help shippers stabilize their networks and provide reliable service to guard against volatility.
On the carrier side, we continue to make freight more accessible than ever before and empower drivers with services like our carrier wallet, which provides fuel discounts and some of the fastest payment times in the industry. And with dedicated lanes, carriers of all sizes can earn consistent income, work more efficiently with facilities, and grow their businesses by locking in regular loads across 1,000-plus dedicated lanes and plan their operations up to 3 months in advance, giving them more flexibility and time to focus on running their business.
In 2022, Uber Freight’s platform will continue to help both sides of the freight industry adapt rapidly to market shifts to balance supply and demand and to keep goods moving.
If you’re a shipper with questions about how to plan your transportation strategies in an all-weather market, please visit us here.
If you’re a carrier interested in hauling with Uber Freight, click here to sign up today.

With instant quotes, real-time tracking, and 24/7 access to trusted carriers, Uber helps streamline your operations.
With upfront pricing, instant booking, and facility ratings, Uber Freight puts you in the driver’s seat.