
Three pressures are hitting the freight market simultaneously: fuel costs, counter-seasonal truckload tightening, and regulatory changes that are driving capacity out of the market. Unlike a market that’s following seasonal cycles, these forces are converging across routing guides, LTL networks, and cross-border operations all at once.
Data from Uber Freight’s Q2 Market Update and Outlook Report points to a common theme: the window to get ahead of these conditions is narrowing, and the shippers best positioned for what’s ahead are adjusting their strategies now. Below is where the market stands today and what shippers should be doing to stay ahead.
Truckload capacity continues to tighten
The current market tightness is mostly supply-driven, with the FMCSA’s non-domiciled CDL final ruling expected to remove 40,000 drivers annually over the next five years, and tractor sales are down 27.2% year-over-year. Spot rates remain elevated by more than 25% year-over-year, excluding fuel, increasing supply-side pressure. But while the rise in spot rates has boosted Class 8 orders, new capacity won’t arrive immediately to ease current conditions.
On the demand side, the ISM PMI remained at 52.7 in April, above the 50.0 expansion threshold, signaling sustained economic expansion. Additionally, the wholesale inventories-to-sales ratio is at its lowest level since COVID, which could potentially create a tailwind for demand as inventories are replenished.
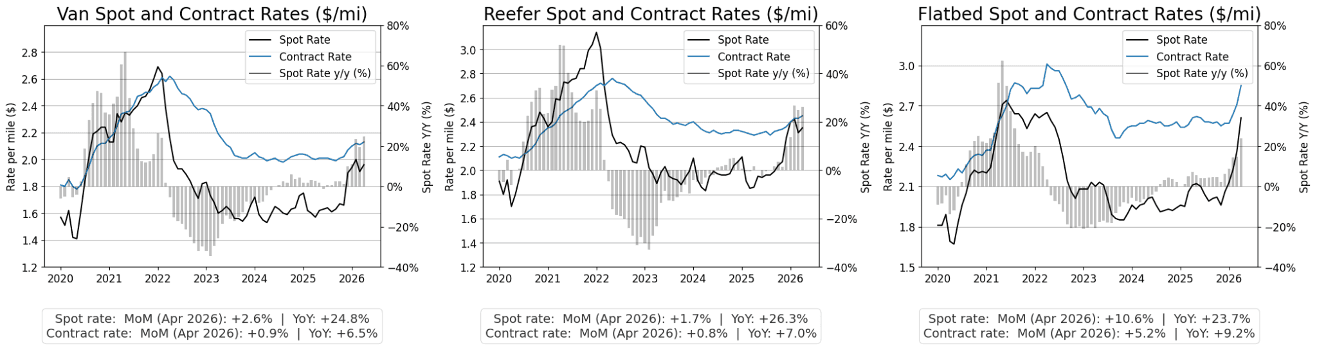
First-tender acceptance dropped from to 82% in April, increasing costs as rejected shipments move down routing guides or into the spot market, where volumes are up 44% year-over-year. As spot rates rose counter-seasonally across all three trailer types in April, further tightening is likely to continue through the June and July peak season.
Our recommendations for shippers:
Plan budgets to the H2 forecast—not 2024 and 2025 conditions. Spot rates are likely to run 25% or higher compared to 2025 levels. Contract rates are expected to run up to 10% higher through the rest of the year, excluding fuel. Using previous years as a baseline will leave budgets exposed.
Reevaluate network opportunities.Identify where freight can shift strategically—such as through intermodal—to offset rising fuel and linehaul costs and potentially reduce total transportation spend.
Plan peak capacity 30 to 60 days in advance. Adding dedicated capacity on short notice is more difficult in a tightening market. Evaluate projected demand for peak and produce season demand and plan accordingly to avoid spot exposure.
Pre-negotiate critical lanes before bid events. Using lane-level data and detailed volume forecasts gives shippers stronger positioning and ensures they get the most accurate carrier pricing.
Watch route guide depth, not just price. Tracking first-tender acceptance and cost-over-primary carrier, lane by lane, helps shippers act before routing guides break down, better than spot prices alone.
Diesel prices continue to reach record highs
Supply-side pressures are only part of the story as geopolitical volatility continues to push diesel prices higher. April alone saw an 11.2% month-over-month increase, and the U.S. national average diesel hit $5.64 per gallon for the week of May 11—up from $3.72 in February. Multiple Midwest states also set records, with prices exceeding $6.00 per gallon in Michigan and Illinois.
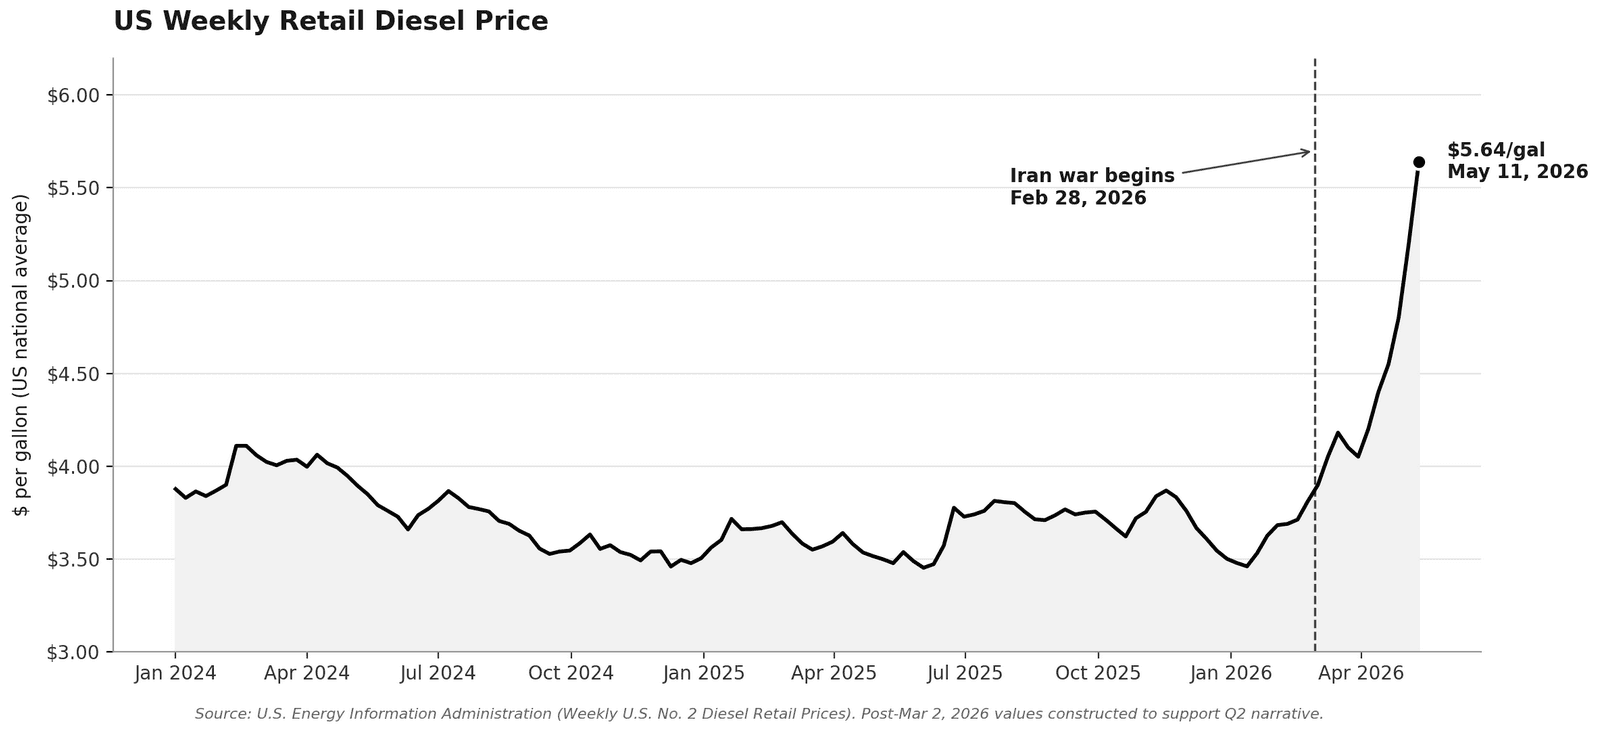
Higher fuel prices have contributed to spot rates rising 40% to 45% year-over-year. As carriers look to protect cash flow on high-fuel-cost corridors, lower margin lane rejections are increasing. And because fuel surcharges are usually calculated on a per-mile basis, carriers are now baking idling costs and deadhead moves into them. More importantly, while shippers are seeing these costs in their budgets now, they may not fully reverse once fuel stabilizes, due to other structural market pressures.
To further protect against rising costs, shippers should:
Audit fuel surcharge clauses this month to confirm they reflect current market conditions.
Shorten surcharge review cycles to weekly index-linked adjustments to align transportation costs more closely with actual fuel prices, reducing the risk of large price swings in between reviews.
Add fuel accessorials in markets without standard FSCs to create greater pricing transparency.
Eliminate dwell and deadhead, as these can drive carrier rates up.
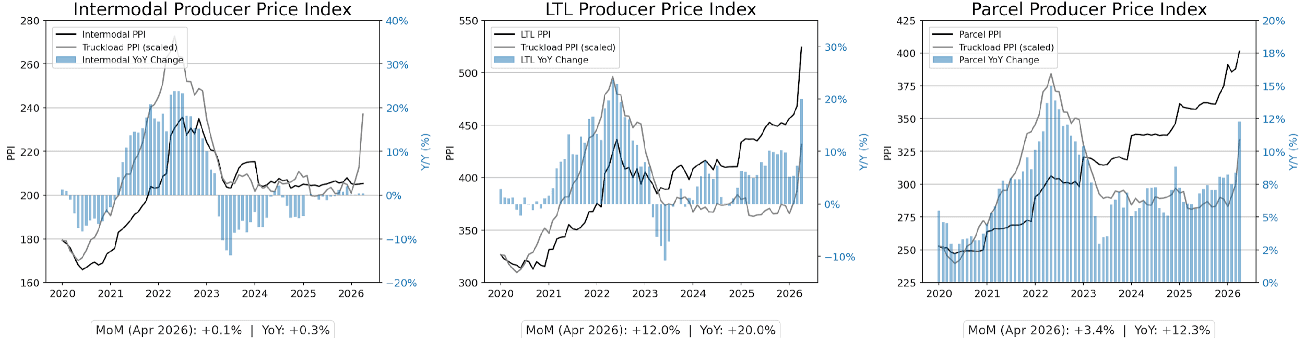
LTL networks are absorbing demand quickly
As the truckload market tightens, partial loads and large LTL shipments are moving to LTL carriers. The LTL Producer Price Index is currently more than 20% higher than the comparable 2025 levels. Because the LTL market is absorbing this overflowing demand quickly, it’s impacting carrier service levels, especially as industry capacity hasn’t fully recovered from Yellow’s 2023 collapse.
With these shifts, large industrial and CPG shippers are also beginning to reduce daily and premium LTL volume by focusing on consolidation and deferred options. As this is a structural change, it won’t show up in rate indices for another quarter. However, it will reshape the carrier yield mix as it spreads beyond CPG.
Operational steps shippers should consider:
Run a segmentation exercise.Map lanes by required service level and align each segment with the right LTL/carrier mix, sailing schedule, or consolidation strategy.
Audit shipping hygiene at key origins, including dock readiness, paper, and detention patterns. Treat detention reduction as a cost lever, not just a service metric. Poor shipping hygiene can swing rate evaluations by 10% or more when carriers assess accounts.
Consolidate freight across similar volume lanes. Pool, zone-skip, or consolidation can reduce costs. Uber Freight experts have set up multiple outbound pools and consolidation programs, resulting in measurable savings for customers.
Cargo theft is becoming more sophisticated
According to CargoNet, there were 767 supply chain crime events across the U.S. and Canada in Q1—down 5.3% year-over-year. However, there has been a significant increase in email threats as bad actors target credentials at mid-size and large fleets. Social engineering and change-of-ownership fraud are also on the rise. Change-of-ownership fraud saw a 169.6% year-over-year increase in Q1, with approximately half of Q1 theft incidents tied to carriers holding legitimate motor carrier numbers and previously clean operating histories.
In response, legislative and policy reforms are moving forward. Proposed federal legislation would require carriers, brokers, and forwarders to notify the FMCSA of any ownership change within 30 days. It would also phase out the use of motor carrier numbers within five years.
Ways to reduce cargo risk:
Lock down account security. Strong controls over account access and following fraud prevention best practices are the best defenses. Ensure teams are aware of the most common tactics used by bad actors and how to avoid them.
Verify across the full shipment lifecycle,as tender-sage controls alone are no longer sufficient to prevent theft.
Scrutinize carriers with recent authority transfers and validate them before booking.
Build corridor-level disruption playbooks to ensure fraud or theft is dealt with swiftly.
Volatility and tariffs continue to shape cross-border networks
With changing policies and market uncertainty, shippers need to be aware of the unique challenges in each region. Tariff moves, new regulations, carrier exits, and geopolitical volatility are all factors that can impact cross-border operations.
Overall, in ocean shipping, global service schedule reliability remained around 63%. With the Strait of Hormuz blockade, transits have fallen from about 138 vessels per day pre-conflict to almost zero since May 6. The disruptions to the Red Sea and Suez Canal have added 10-15 days to Asia-USEC and Asia-Europe transits. For key trades like Asia and Europe, the vessel orderbook points to medium downward pressure on rates, but geopolitical factors are keeping spot rates and reliability volatile.
With IEEPA duties suspended, shippers are aggressively front-loading cargo. Volumes are well above normal seasonal patterns, contributing to increased booking pressure. In Uber Freight’s network, we’re seeing disruptions manifest as lane-level shocks rather than global averages. This looks like sudden closures, delays, and rate spikes on certain corridors. Shippers are using contingency plans and routes to proactively keep freight moving.
Importers across North America are also focusing on the CAPE process. There are $166 billion in refunds for IEEPA duties across more than 330,000 importers. As of May 11, $35.46 billion in refunds are in the pipeline. Refunds depend on product and import volumes so they can range from a few thousand to several million dollars. So far, Uber Freight has recovered $3-$4 million USD in refunds year-to-date for our Mexico-exposed customers.
Ways to effectively manage cross-border operations:
Stay proactive on cross-border rates. Planning ahead and having a spot playbook for quick decisions after a rejection prevents lane-by-lane scrambling. Faster decision-making protects coverage and costs.
Keep your carrier base flexible. Don’t limit cross-border capacity to a few providers and plan for a tighter market. Work with carriers who have CTPAT certifications or partners who can guarantee certified, reliable capacity when you need it.
Build corridor-level playbooks. Instead of a single global plan, treat each major trade lane as a separate scenario. Define alternate ports and modes, pre-approved backup carriers, and consolidation options so you’re not reactively responding to tariffs, customs, or weather issues.
Capture the CAPE refund window now.Secure ACE Portal access, enroll in ACH refunds, and audit entry data for accuracy. The system doesn’t allow amendments, so any missing data means missing money. Working with a trusted partner like Uber Freight, which offers CAPE filing services and ACE account guidance, can also ensure you maximize your refunds.
Looking ahead: Closely monitor the market
Evolving trade policies and shifting conditions will continue to impact the market as we move through the second half of 2026. Shippers and carriers should stay informed about market trends, leverage technology to improve efficiency, and build strong relationships with their partners. By staying agile and proactive, logistics professionals can navigate uncertainty and capitalize on opportunities ahead.
For a more in-depth look at the freight market in Q2 2026 and what’s to come, including additional insights on U.S. bulk and intermodal, cross-border operations, and market disruptions, read the full Q2 Market Update and Outlook Report.
*All data is generated by Uber Freight internal indices using a weighted combination of truck and driver availability for supply, and manufacturing output, goods consumption, imports, and exports for demand.