
The Freight Economist
Weekly market update
The Freight Economist is back—now weekly—with the data-driven market intelligence your business needs to stay competitive. Read on for a breakdown of shifting freight rates and upcoming market outlooks.
The spot market saw relative stability in September, but fuel prices hit an all-time high
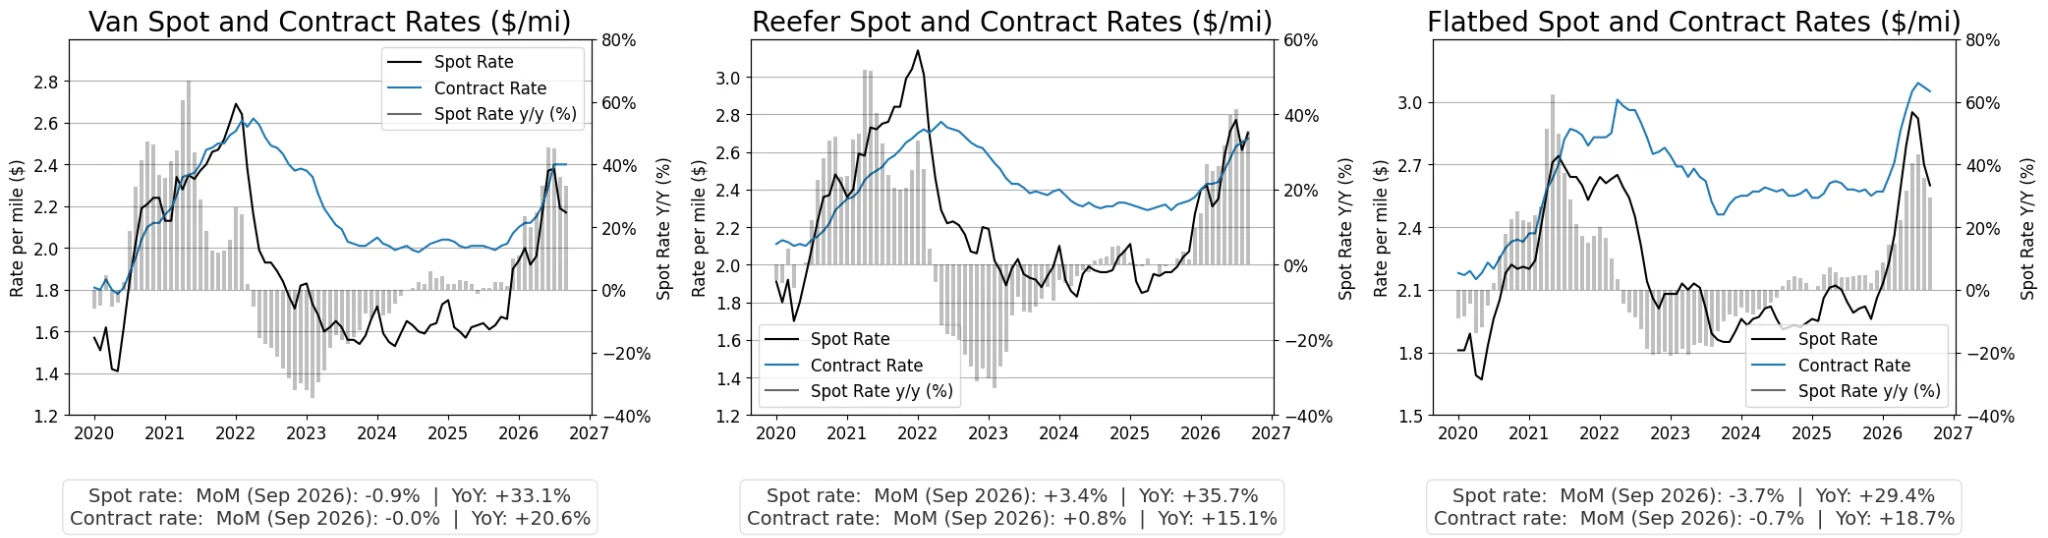
In September, van linehaul spot rates (excluding fuel) decreased by 0.9% MoM, flatbed rates fell 3.7%, and reefer rates rose 3.4%. Across all trailer types, spot rates remained 29%–36% higher YoY, while contract rates held 15%–21% above prior-year levels. However, shippers saw little relief from the softening market; record-high fuel prices drove the average fuel surcharge to $0.73 per mile, offsetting linehaul rate decreases.
Brace for market tightening
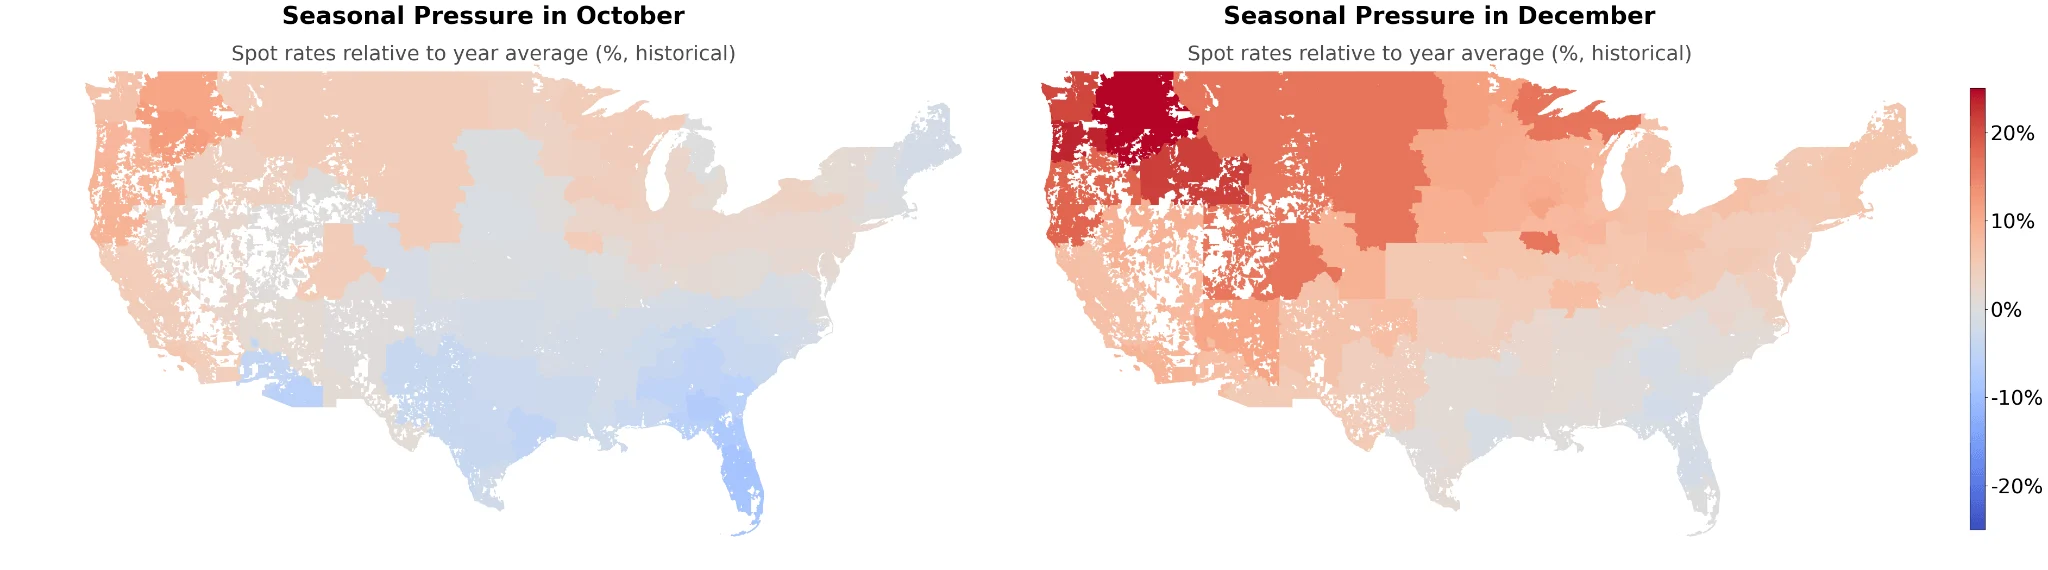
Following a period of relative stability in August and September, market tightness typically builds in October across Northern regions—especially in the Pacific Northwest—while Southern markets like Texas and Florida remain soft. Tightening intensifies throughout Q4, expanding across the entire continental U.S. by December. With early signs of tightening in October, shippers should optimize network strategies—such as implementing mini-bids and extending lead times—ahead of peak season and potential Q1 weather disruptions.
US manufacturing continued to expand in September
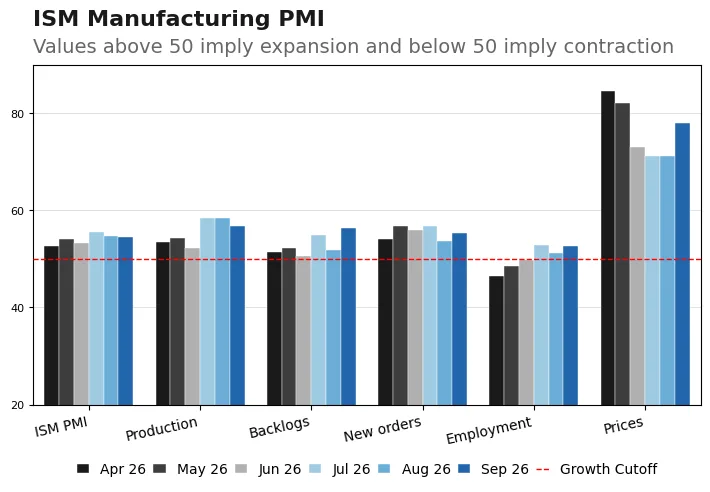
The ISM Manufacturing PMI rose to 54.5 in August—extending its expansion streak to nine straight months, supported by strong new orders (55.3) and production (56.7). Low customer inventories (41.6) signal ongoing room to restock, though a prices index near 80.0 underscores persistent cost inflation.
Looking for more insights? Download the full report
Get The Freight Economist weekly
Don't miss out on essential freight intelligence. Sign up for The Freight Economist to get our weekly insights on rates, employment, and market outlooks delivered straight to your inbox.