
Q3 freight market update: Repairing networks as we head into Q4
After a volatile first six months of the year, Q3 saw a bit more stability for shippers in certain segments of the market. Truckload growth slowed after two volatile quarters, particularly in the Southeast, while Mexico cross-border capacity loosened from its Q2 peak.
Still, the broader network remains under pressure, with LTL prices reaching record highs and intermodal capacity tightening.
That makes the next several weeks an important planning window. Uber Freight’s Q3 Market Update and Outlook Report shows where shippers can strengthen routing guides, secure critical capacity and build backup options heading into peak season.
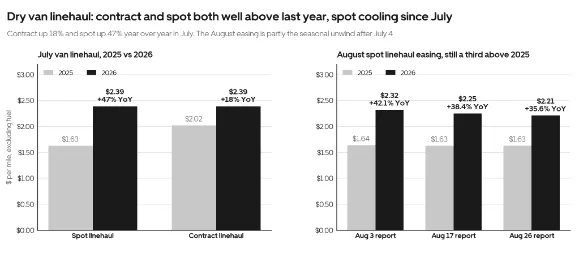
Easing truckload conditions creates time to repair weak lanes
Rapid rate increases during the first half of the year exposed weaknesses in many shippers’ routing guides. Contract rates set earlier in the year were no longer competitive on some lanes, leading carriers to reject more shipments, asking for contract rate increases, and pushing shippers into the spot market to find last-minute coverage. By July, dry van spot rates had risen 48% year-over-year, and contract rates 19% YoY .
Some of that pressure eased in Q3. Shippers began repricing underperforming lanes, helping routing guides recover and bringing tender acceptance up to 78% in August. Spot rates also declined for seven consecutive weeks following the early-July peak. But the market remains more expensive than it was a year ago: the average dry van spot rate was up 36% year-over-year as of August 26.
The underlying pressures remain as well. First, capacity, with 48,000 non-compliant drivers leaving the market over the past year and a backlog in equipment production. Second, fuel prices. The average diesel price reached nearly $6 per gallon in the first week of September, an all-time high. If fuel remains elevated into bid season, carriers are likely to seek larger rate increases, even with a fuel surcharge in place.
The recent easing gives shippers an opportunity to address problems before Q4. Targeted weekly or monthly mini-bids can help reprice the specific lanes where carriers are rejecting freight. Shippers can also improve their chances of securing capacity by:
Giving carriers 48 to 72 hours of lead time and keeping shipment volumes as consistent as possible
Combining orders into fewer, fuller shipments. One CPG shipper extended its lead time from 24 to 48 hours and held compatible orders for consolidation. It increased truck utilization by 6%, reduced the number of daily shipments by 70, and improved routing guide compliance by eight percentage points.
LTL carriers have reclaimed pricing power
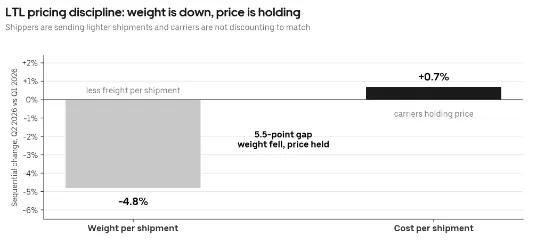
The surge in truckload volume has spilled over into the LTL market. The TD Cowen-AFS LTL rate-per-pound index reached an all-time high in Q2, 77% above its 2018 baseline, and is forecast to move higher in Q3. Contract renewals are landing in the mid-to-high single digits. Private carriers also increased revenue per shipment 11% year over year in Q2 even as daily shipment counts remained flat.
Carriers are prioritizing yield over volume. Rising truckload prices are pushing excess and deferred freight into LTL terminals, while dimensional pricing, minimum charges, and accessorials are raising the cost of inefficient shipments. Standard transit times are already slipping in some national carrier networks.
Shippers should focus on the freight profile they can control. Grouping shipments into fewer, heavier loads and improving packaging density can reduce exposure to minimum charges and dimensional-pricing penalties. It is also worth comparing volume LTL, partial truckload, and parcel options more frequently. The crossover points will continue to move as truckload conditions change.
Operational steps shippers should consider:
Consolidate shipments and improve packaging density.
Compare alternatives to standard LTL more frequently.
Audit accessorial charges and address their underlying causes.
Add regional LTL carriers through targeted lane-level bids.
Intermodal still offers savings, but the gap is narrowing
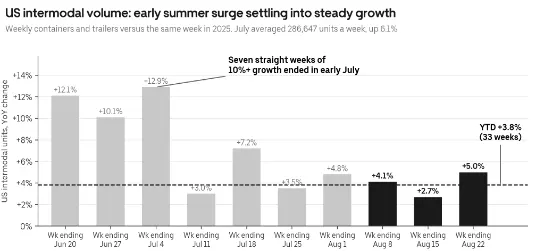
Intermodal helped many shippers offset rising truckload costs in Q2. That shift has now absorbed much of the available capacity. U.S. intermodal volume was up 3.8% year-to-date through August 22, and providers began applying peak-season surcharges in early July, about two months earlier than usual.
Rates have increased 10% or more in capacity-constrained markets such as Los Angeles and Laredo. Peak surcharges out of Los Angeles range from $500 to $1,000 per box and are expected to remain in place through the end of the year.
Intermodal can still be the right choice, but it is no longer as favorable relative to truckload as it was in the spring. Shippers should re-evaluate the modal mix lane by lane and secure intermodal capacity before the heart of peak. Where the service is critical, contracted capacity will offer more protection than relying on the spot market late in the year.
Our recommendations for shippers:
Secure capacity before the heart of peak season.
Lock in longer-term rates before Q4 and 2027 increases.
Diversify intermodal providers to deepen routing guides.
Cross-border networks need built-in flexibility
Mexico's cross-border capacity has eased since its Q2 peak, but the cost floor remains higher than at the start of 2026. About 20,000 Mexican drivers lost their U.S. visas between April 2025 and April 2026. In mid-August, the Laredo van load-to-truck ratio stood at 8.0 to 8.5. That was down from roughly 10:1 in Q2 but still 61.9% higher than a year earlier.
At the same time, tariff changes and heightened border inspections are creating uneven volume and longer wait times. Repeated changes during Q3 (Section 122 expiring and Sections 301 and 338 taking effect) caused shippers to pull freight forward ahead of a policy shift, then slow orders for several weeks. This makes capacity harder to plan and reduces driver turnover at major gateways.
As a result, transloading is moving from a short-term workaround to part of network design. Shippers that previously relied on direct-trailer B1 capacity are adding cross-dock options in Laredo and, increasingly, El Paso. A hybrid model allows freight to move between direct and transload options as border conditions change.
Canada presents a more balanced domestic picture. The S&P Global Canada Manufacturing PMI reached 53.5 in July, its highest level in four years, while truck driver employment increased nearly 10% quarter over quarter in Q2. But Canada-U.S. cross-border capacity remains more volatile and carrier-favorable. U.S. enforcement and work visa restrictions continue to limit the driver pool, and carriers are pricing downtime and deadhead into cross-border rates.
For both markets, the priority is flexibility. Shippers should establish backup capacity before Q4 volume arrives, review cross-border lanes frequently, and avoid relying on a single operating model.
Ways to effectively manage cross-border operations:
Build a hybrid network using direct B1 and transload capacity.
Move from week-to-week spot buying to proactive sourcing.
Review carrier mix and modal options lane by lane.
Decide whether cost or speed takes priority before congestion builds.
Build a defined spot-procurement process for routing-guide failures.
Validate contract rates on Canada-U.S. lanes.
Map tariff exposure by product and direction of travel.
Budget for continued cross-border rate volatility.
Looking ahead: Repair as you prepare
This peak season is beginning with many shippers still quoting and securing capacity week to week. That leaves little room if demand rises suddenly. Intermodal peak pricing is already in effect, LTL carriers are positioned for stronger Q4 yield management, and cross-border capacity can tighten quickly when policy changes or weather disrupt key gateways.
The next 30 to 60 days are an opportunity to prepare without overhauling the entire network. Repair the lanes that are failing. Give carriers more lead time. Secure baseline capacity where it matters most, then build backup options for a surge.
For a more in-depth look at the freight market in Q3 2026 and what is ahead, including additional insights on diesel, cargo theft, bulk, international shipping and Europe, read the full Q3 Market Update and Outlook Report.
*All data is generated by Uber Freight internal indices using a weighted combination of truck and driver availability for supply, and manufacturing output, goods consumption, imports and exports for demand.
Uber Freight is a licensed freight broker and is not a motor carrier.