
The freight market is entering a more complex phase in 2026. Capacity pressures are returning to truckload networks, cargo theft remains elevated across North America, and policy shifts—from tariffs to carrier regulations—are reshaping how shippers plan their networks.
Insights from Uber Freight’s Q1 Market Update and Outlook Report highlight several signals that supply chain leaders should be watching closely. While conditions vary by mode and region, the data points to a common theme: planning cycles are shortening, and flexibility is becoming more valuable than ever.
Below are several key takeaways from the report and what they mean for shippers navigating the year ahead.
Truckload capacity is tightening again
Even with seasonal headwinds, the market remains structurally tight. First-tender acceptance is hovering around 85%, significantly lower than last year’s 92%. This has led to elevated shipper costs, as rejected shipments are either moving down routing guides or into the spot market.
With organic supply reductions, weak equipment sales, and regulatory tightening, the gap between supply and demand is widening. Currently, spot rates remain elevated by more than 25% year-over-year, increasing supply-side pressure. But while the rise in spot rates has boosted Class 8 orders, it’s not expected to fully improve capacity in 2026—primarily due to long lead times.
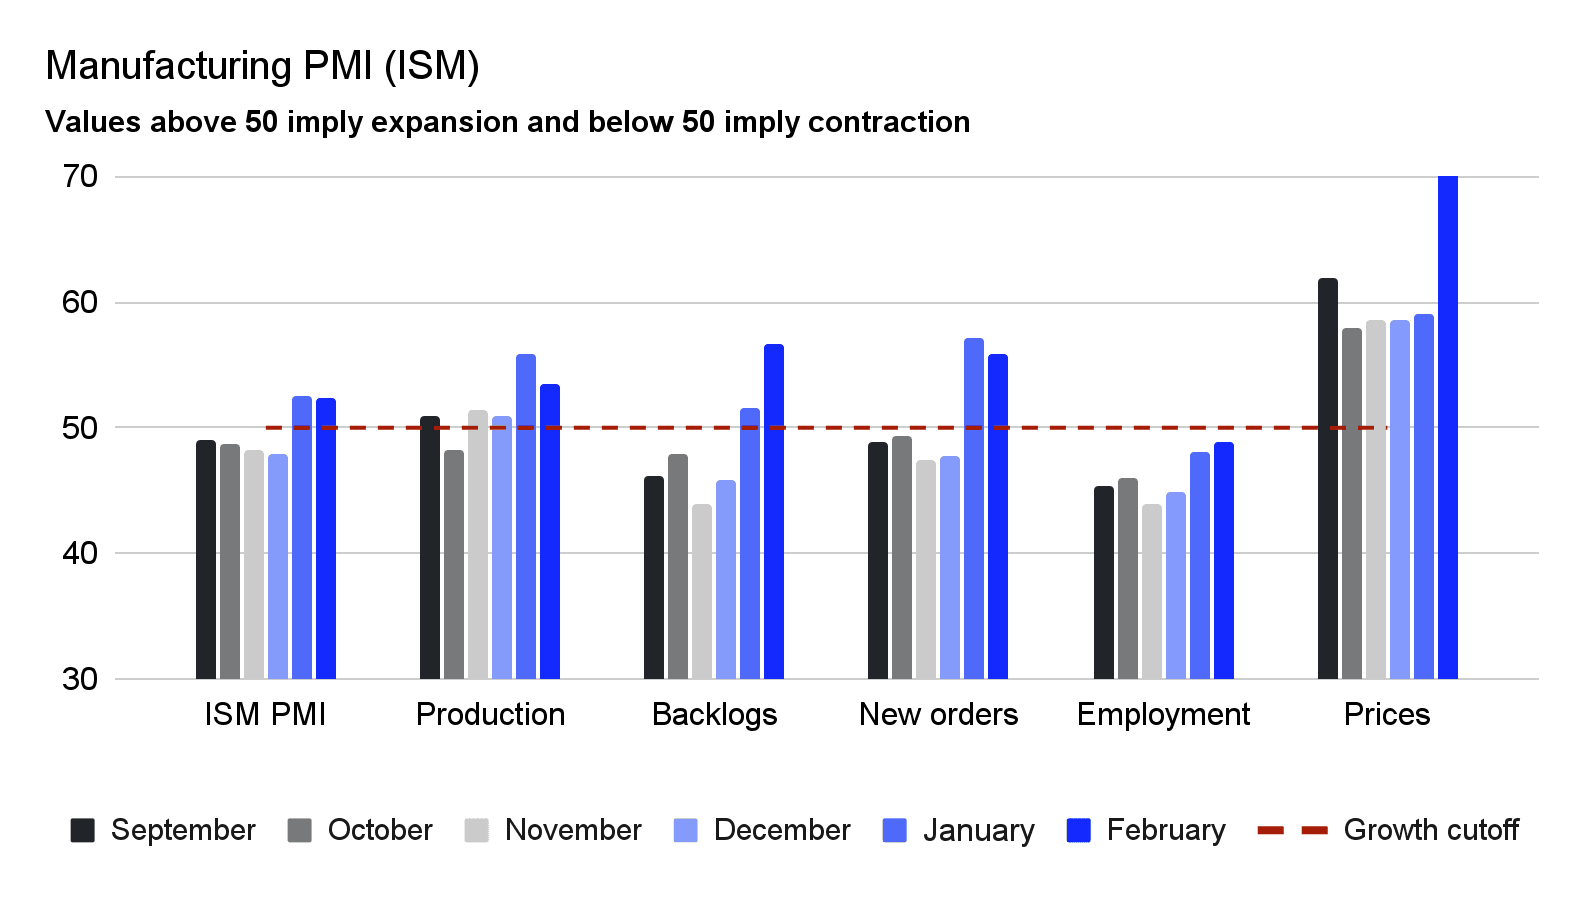
On the demand side, there is a split based on sectors. Consumer-oriented lanes, like retail and CPG, are driving volume growth, while industrial sectors remain stagnant. However, manufacturing output and orders have shown positive signs, potentially signaling a recovery.
Shippers should expect tighter conditions on key lanes, especially in weather-sensitive corridors, as tender rejections rise and spot rates increase. Because of this, closely monitoring the market and exercising caution is key. Right now, leading shippers are locking in reliable capacity ahead of further rate increases. They’re also tracking market shifts and routing guide failures to ensure they’re prepared for any scenario.
Our recommendations for shippers:
Strengthen routing guides while first tender acceptance rates remain stable. Use this time to reduce unnecessary spot exposure, tighten primary guides, optimize high-dwell sites, and address higher-risk carriers.
Focus on short-term (30-90-day) pricing resets on specific lanes. However, avoid chasing the lowest prices, as this could lead to carrier issues and declining routing guide performance.
Prioritize and diversify capacity on critical lanes. Regularly review carrier risk and keep flexible options open to avoid overexposure with upcoming compliance and capacity pressures.
Build strong relationships with key providers in your network to strengthen carrier relationships and become a shipper of choice.
Create a live playbook. When RFP awards are rejected, use tools like Uber Freight Exchange to adjust quickly instead of defaulting to unmanaged spot or a full, high-cost procurement event.
LTL networks could see volume spillover
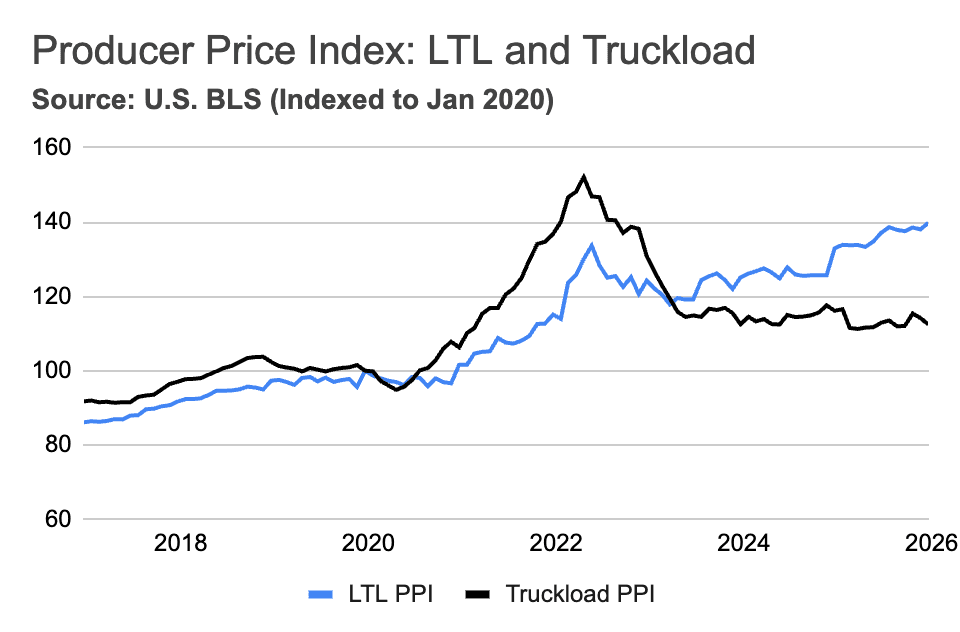
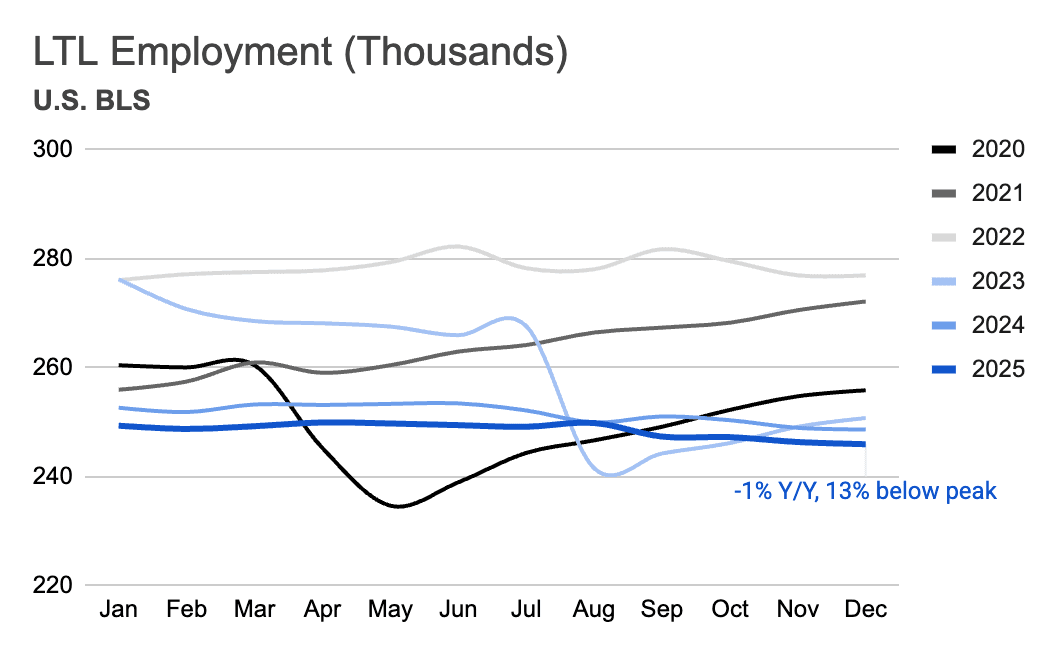
LTL rates are at an all-time high, currently up 5.2% year-over-year. As the truckload market tightens, shipments are likely to overflow into LTL, increasing volume. LTL has faced weak demand, with carriers reducing headcount over the last three years.
With these shifts, large industrial and CPG shippers are beginning to rethink their legacy LTL strategies. This includes considering ways to reduce daily and premium LTL and focusing more on efficient moves with consolidation and deferred options.
Operational steps shippers should consider:
Run a segmentation exercise. Map lanes by required service level and align each segment with the right LTL/carrier mix, sailing schedule, or consolidation strategy.
Audit shipping hygiene at key origins, including dock readiness, paper, and detention patterns. Treat detention reduction as a cost lever, not just a service metric. Poor shipping hygiene can swing rate evaluations by 10% or more when carriers assess accounts.
Use strategic sourcing to fill any network gaps and create the right solutions for customers.
Focus on cost control and savings opportunities by understanding cost profiles with carriers and how to better support them.
Embrace technology solutions to streamline procurement and improve efficiency.
Watch public carrier earnings. If volumes rise but yields decline, carriers may be buying share, which doesn’t signal a structural recovery.
Cargo theft remains an operational risk
Across North America, cargo theft, fraud, and extortion remain elevated, posing significant operational risk. Although networks have worked to improve security, industry-wide incidents increased by 18% in 2025.
In response, legislative and policy reforms are moving forward. Two examples are the Combating Organized Retail Crime Act (CORCA) and the Household Goods Shipping Consumer Protection Act. Both aim to curb organized theft and protect shippers and consumers.
Even with increased industry risk, we’ve seen fraud incidents fall 20% across the Uber Freight Network. This has been driven by tightened carrier onboarding, close monitoring, proactively identifying fraud attempts, and partnerships with organizations like CargoNet.
Ways to reduce cargo risk:
Use strategic route planning to avoid high-risk areas.
Prioritize daytime transit when possible.
Use escorts or professional security for high-value cargo.
Maintain continuous communication with trusted logistics partners.
Build corridor-level disruption playbooks to ensure fraud or theft is dealt with swiftly.
Employ strong digital hygiene across the supply chain to bolster high visibility and control.Ensure teams are aware of bad actors’ most common tactics and how to avoid them.
Cross-border networks face growing volatility
With changing policies and market uncertainty, shippers need to be aware of the unique challenges in each region. Tariff moves, new regulations, carrier exits, and severe weather are all factors that can impact cross-border operations.
Overall, in ocean shipping, global service schedule reliability decreased modestly month-over-month, to around 63%. Vessel delays are at just over five days, the second-highest since April 2025. However, both metrics are improving year-over-year. Compared to last year, import volumes remain soft, but have begun to normalize after 2025’s tariff-driven surge. For key trades like Asia and Europe, the vessel orderbook points to downward pressure on rates, but geopolitical factors are keeping spot rates and reliability volatile.
The recent ruling on IEEPA tariffs—which found that President Trump exceeded his authority and invalidated most reciprocal and targeted tariffs—lowered average effective tariff rates. However, if the current global tariff rate of 10% increases to 15%, some lanes could be pushed back to prior levels.
Across Uber Freight’s network, we’re seeing disruptions manifest as lane-level shocks rather than global averages. This looks like sudden closures, delays, and rate spikes on certain corridors. Shippers are using contingency plans and routes to proactively keep freight moving.
In Mexico and Canada, shippers are increasing mini-bids, executing routing guide resets, and focusing on benchmarking and early Q3 conversations as they respond to new regulations, changing rates, and freight volumes.
Preparing for cross-border disruption:
Build corridor-level playbooks. Instead of one global plan, treat each major trade lane as its own scenario. Define alternate ports and modes, pre-approved backup carriers, and consolidation options so you’re not reactively responding to tariffs, customs, or weather issues.
Tighten visibility and lead time discipline. Prioritize tools and processes that improve schedule visibility, exception monitoring, and short-lead replanning to move quickly when a lane closes or a sailing is rolled.
Take advantage of mixed tariffs. Consider a selective pull-forward of strategic orders where effective tariff rates are lower. For higher effective tariffs, actively stress test landed-cost assumptions and rebalance sourcing and routing.
Looking ahead: Closely monitor the market
Evolving trade policies and shifting conditions will continue to impact the market as we move through 2026. Shippers and carriers should stay informed about market trends, leverage technology to improve efficiency, and build strong relationships with their partners. By staying agile and proactive, logistics professionals can navigate uncertainty and capitalize on opportunities ahead.
For a more in-depth look at the freight market in Q1 2026 and what’s to come, including additional insights on U.S. bulk and intermodal, cross-border operations, and market disruptions, read the full Q1 Market Update and Outlook Report.
*All data is generated by Uber Freight internal indices using a weighted combination of truck and driver availability for supply, and manufacturing output, goods consumption, imports and exports for demand.