Uber Freight’s market outlook shows ongoing tightness in 2022
Supply chains have faced unprecedented disruptions throughout the last 2 years, starting with the toilet paper Hamsterkauf, followed by an unexpected winter freeze and a spike in demand that caused more than 70 container ships to wait at anchor in the port of LA. In their 2021 earnings calls, S&P 500 companies mentioned ‘supply chain’ and ‘inflation’ at the highest rate in at least 10 years. So how will 2022 unfold?
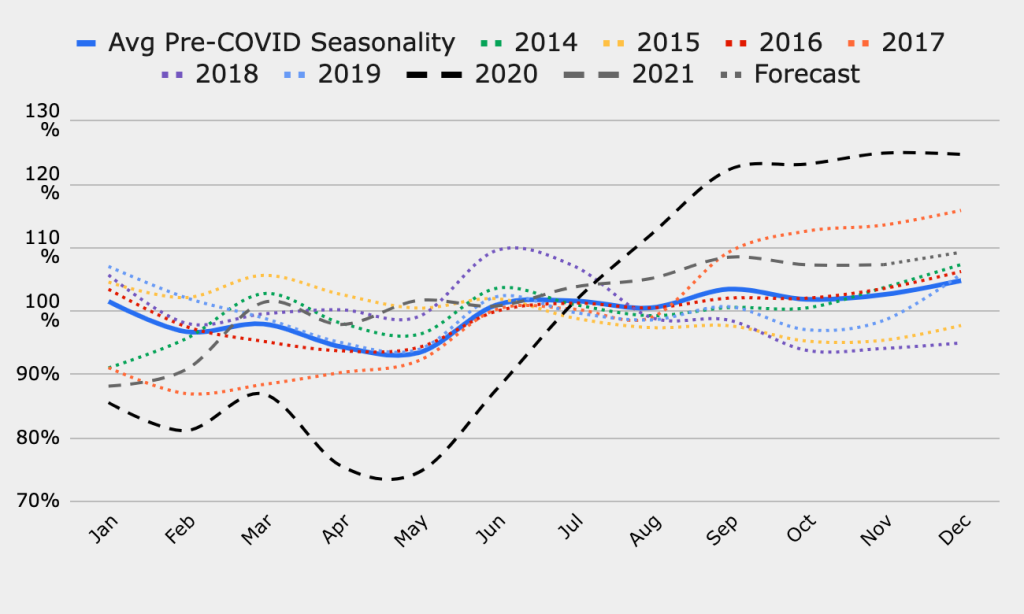
Traditionally, early indicators of supply and demand provided some signals about where the market was heading. Pre-COVID demand was characterized by periodic seasonality and relatively stable trends. Supply, on the other hand, followed structural market cycles, and early indicators (such as truck orders) provided strong signals about future capacity. Then the pandemic happened, and the next 2 years became a graveyard for most spot rate forecasts.
At Uber Freight, we have established a quantitative methodology to select the strongest indicators of truckload spot rates. We have identified (1) long-distance truckload employment, (2) Class 8 tractor sales, (3) retail sales, and (4) the ISM Manufacturing Purchasing Managers’’ index (PMI) as key predictors. Below, we present deep dives into each of these predictors and look at how they can unfold in 2022. Based on our learnings, we expect the tight market to continue, at least through the first half of 2022.
“Sorry, can’t do long distance”
Total trucking employment (released by the Bureau of Labor Statistics) is one of the most followed indicators in the trucking industry. This figure dropped sharply at the onset of COVID-19, but has since recovered to almost pre-pandemic levels. So why are rates still elevated?
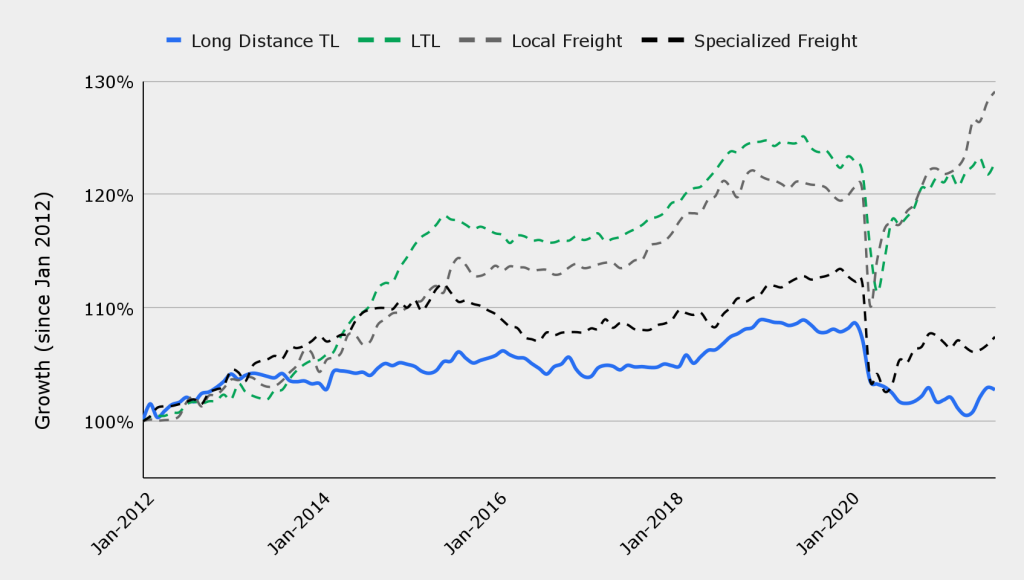
Total trucking employment mainly includes payroll employees in the truckload (dry van), less-than-truckload (LTL), and specialized freight (refrigerated and flatbed) sectors. These are further divided into short-distance and long-distance trucking. With this breakdown, we are able to focus on the most important sub-sector for full truckload: long-distance truckload employment.1
Over the past years, this figure experienced slower growth compared to other sub-sectors, particularly local freight and LTL as shown in Figure 1. COVID-19 has exacerbated this trend, as long-distance truckload employment has not recovered as well as other sub-sectors have. This has been attributed to various factors, including the changing preferences and demographics of the driver population, and the increasing availability of alternative jobs that do not require drivers to be away from home for long periods of time (e.g., local delivery and warehousing).
In 2022, we expect to see some growth in long-distance truckload employment due to high truckload rates and easing employment constraints. However, employment will hardly recover the 20K+ jobs lost since February 2020. Given the negative trend in this sector, tightening Drug and Alcohol Clearinghouse regulations, and competition from other blue-collar sectors, we expect labor shortages to continue, at least throughout the first half of the year.
Class 8 truck sales
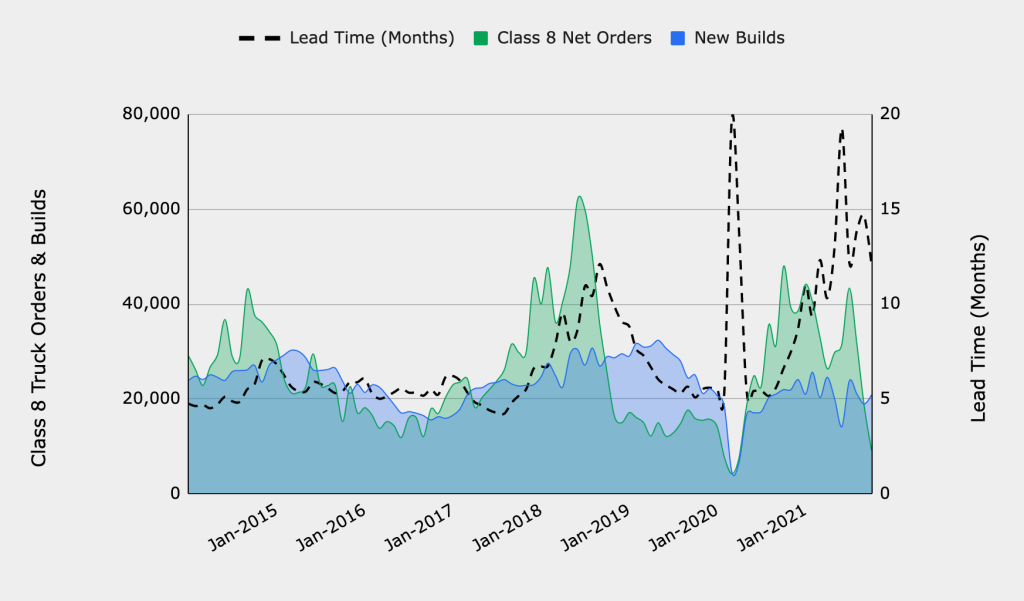
Class 8 truck orders are key inputs to most cycle-driven forecasts. These represent the total number of orders received by the industry each month. Traditionally, truck orders were closely followed by builds and sales (according to ACT Research, a sale takes place when a truck is actually sold to the end user). The time between order and delivery has been historically about 5-7 months, and therefore, orders were strong predictors of capacity entering the market. While a large fraction of sales correspond to the replacement of worn-out trucks, large quantities indicate that additional capacity is entering the market.
Truck builds are currently constrained by the global semiconductor shortage, which has forced several OEMs to shut down factories or curb production. Industry experts are expecting the chip shortage to last into 2022 and, potentially, 2023. This has increased the lead time to record levels, ranging from 10 to 20 months. Despite the high spot rates and the strong truck orders in 2021, monthly builds have been about 25% lower than the 2018 figures, as shown in Figure 2.
Truck orders cannot be a good predictor of future capacity unless we account for the long lead times. Based on this combined effect, we expect some (but not all) of the orders to materialize throughout 2022, which will clear part of the 280K+ order backlog. It will then take another few months for these trucks to actually hit the roads. At Uber Freight, we estimate this time to be approximately 5 months. Therefore, equipment constraints as well as labor constraints will continue to affect capacity in 2022.
The strong demand stimulated the second-hand market, as prices of used trucks have doubled in the past year. However, for how long will used trucks sustain a hot market, especially now that they’re used more than ever?
Consumers running out of steam?
In the few years prior to COVID-19, retail sales and inventories have been growing at a rate of approximately 4% per year. This maintained an inventory-to-sales (I/S) ratio of approximately 1.45. This meant that retailers’ inventories were enough to satisfy 1.45 months of demand. Because of the elevated post-COVID demand, I/S ratio dropped to record low levels as shown in Figure 3.
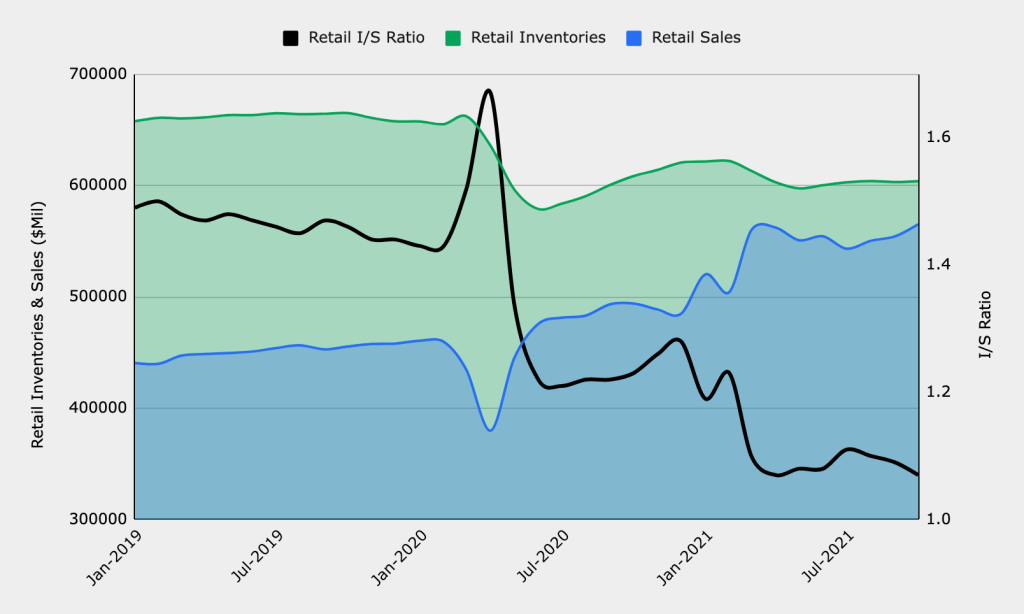
Despite the fact that retail inventories have mostly recovered to pre-COVID levels (except for auto and parts dealers, which are limited by the semiconductor shortage), retail sales continue to be 20% above pre-pandemic levels. There are 2 key drivers of strong demand:
- Accumulation of savings during the pandemic, boosted by stimulus checks. Since COVID-19 started, the US population has saved more than $2.5 trillion in excess of their average pre-COVID savings (or in other words, the equivalent of 24 months of pure savings).
- Personal consumption expenditures shifting from services to goods, especially with the relentless COVID waves.
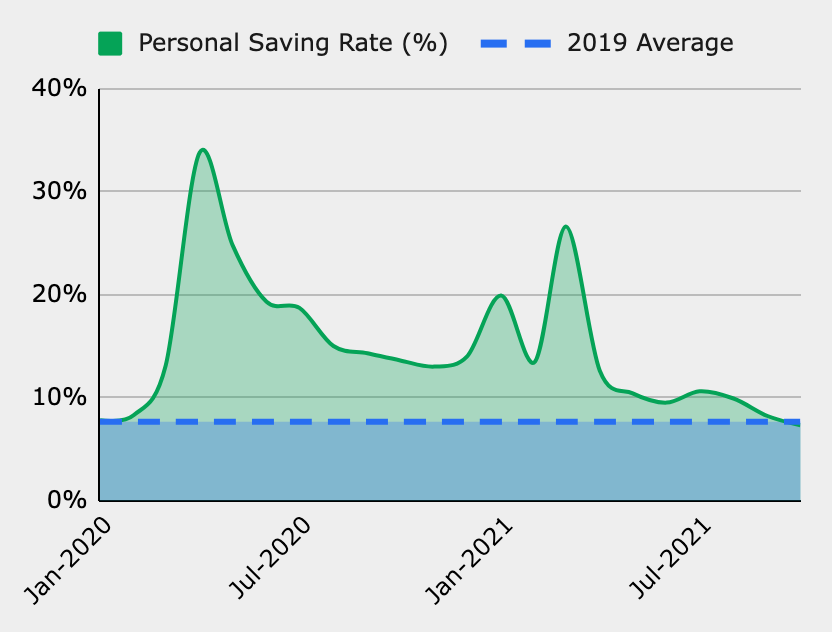

In 2022, we expect both of these trends to be gradually reversed. In the last quarter of 2021, personal savings have already normalized to pre-COVID levels (7.4% in September). In addition, consumer savings have been dwindling quickly for many. This indicates that consumers are running out of steam, assuming there will not be a fourth round of stimulus checks. In addition, the reopening of the economy might shift consumption back from goods to services, unless new virus variants result in unexpected closures. Finally, high inflation, which, even if believed to be transitory, will curb demand as well. As of today, most economists think a fourth stimulus check is unlikely if millions remain outside of the labor force, and expect inflation to remain elevated in 2022.2
Manufacturing is on a roll
Industrial production and manufacturing drive a sizable portion of freight demand. As shown in Figure 5, the Cass Shipments Index, a widely adopted measure of freight demand, is highly correlated with the NAICS industrial production: manufacturing index.

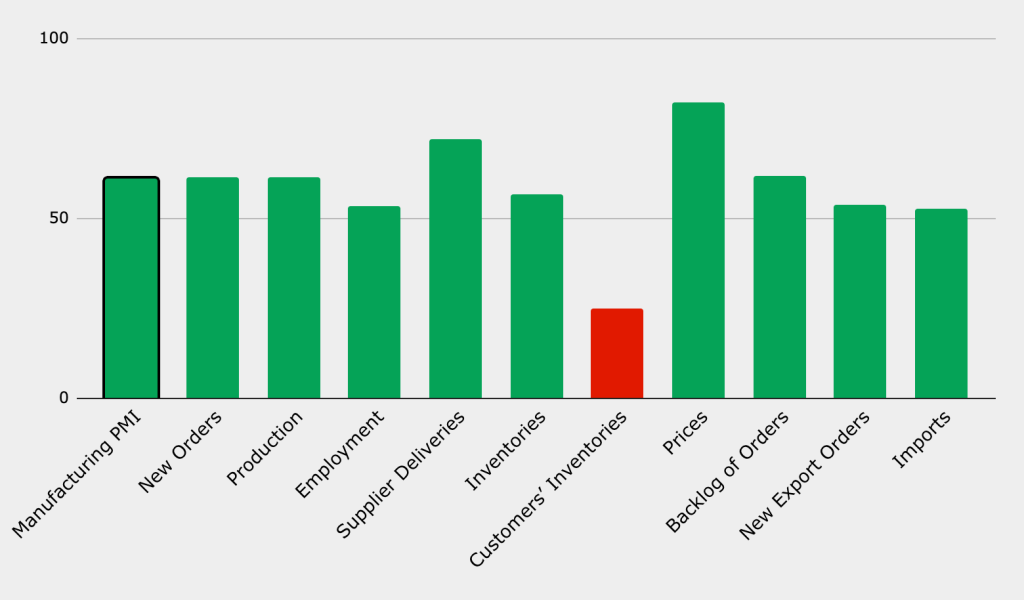
Industrial production has had a speedy recovery since COVID-19, to almost pre-COVID levels. To track manufacturing activity, the Institute for Supply Management (ISM) provides its manufacturing composite index, which combines 5 indicators with varying weights: new orders, production, employment, supplier deliveries, and inventories. An index of more than 50 indicates an expansion in the corresponding segment in comparison with the previous month, whereas a reading below 50 indicates a contraction.
Despite the persisting supply chain constraints, recent values of the ISM Manufacturing Index were above 60, indicating substantial month-over-month growth. Particularly, growth in new orders and order backlogs and contraction in customers’ inventories all point toward increasing manufacturing demand in the coming months.
Putting it all together
Based on the above indicators, we should expect the tight market to continue at least through the first half of 2022. While the past 2 years have been clear outliers when it comes to seasonal effects (as shown in Figure 7), it is reasonable to assume that seasonality will gradually normalize as supply chains adapt to disruptions.
Headwinds, tailwinds
Our analysis reflects Uber Freight’s beliefs about where the market is heading in 2022, assuming there are no major disruptions. However, we acknowledge that, as Nicholas Bohr once said, “Prediction is very difficult, especially if it’s about the future.” What makes predicting the truckload market difficult?
- Disproportionate effects. Small variations in key predictors might have a substantial effect on rates. For example, Professor Jason Miller from Michigan State University estimates that the trucking industry is currently short about 25,000 drivers. This is only about 4% of the long-distance truckload driver population, and about 1.7% of the total trucking employment published by BLS. Therefore, policies that can force even 1% of drivers out of the market will have a disproportionate effect on rates.
- “History doesn’t crawl; it leaps.” —Nassim Nicholas Taleb. Small movements in spot rates driven by supply and demand fluctuations are easier to predict than big leaps that shape the trucking industry for a long time. The ELD mandate in 2018 was one such example. Recently, trucking seemed to have dodged the vaccine mandate threat. If such a mandate were to apply to trucking, many drivers would leave the trucking industry for other sectors.
- Truckload rates are local, but supply chains are global. Factory closures in Vietnam, port shutdowns in China, and low wind seasons in Europe can all have a sizable effect on supply chains in the US.
As shippers prepare for their annual bids, it is important to learn from the lessons of the past 2 years. A softer market toward the end of 2022 might be expected, but is not guaranteed—in 2021, most forecasts got it wrong! Small changes in employment or unexpected policies might push rates upward and cause tender rejection rates to remain elevated, especially for underpriced contracts. Amidst this volatility, unconventional methods such as index-based pricing can provide a hedge against such events and, if the market softens, can result in cost savings.
At Uber Freight, we continue to monitor a wide array of indicators and update our macroeconomic forecast regularly to reflect the most recent changes in the trucking industry.
1Long-distance TL employment is strongly correlated with dry van spot rates (considering YoY differences, the correlation is about -0.45). This makes it a substantially stronger predictor than total truckload employment (correlation is approximately -0.19).
2In SIFMA’s 2021 End-Year US Economic Survey report, the term “supply chain” appeared 40 times (compared to 9 times in the Mid-Year report, and 3-4 times in the 2020 reports)


