
By: Mazen Danaf, Senior Economist, Uber Freight
The US economy grew by 2.9% in the fourth quarter. What does it mean for freight?
The US economy grew at a robust annual rate of 2.9% in the last quarter. However, the strength of the overall economy does not necessarily mean that trucks were busier. The last quarter saw a sharp decline in housing activity. Residential private investment plummeted by 27% on an annual basis, according to the GDP report. In addition, this report had other hidden signs pointing to weaker freight demand.
There are various factors that contribute to GDP. These are generally categorized into (1) personal consumption of goods and services, (2) net exports, (3) private domestic investment, and (4) government purchases. While some of these factors contributed positively to GDP growth in Q4, their implications on freight demand were gloomy.
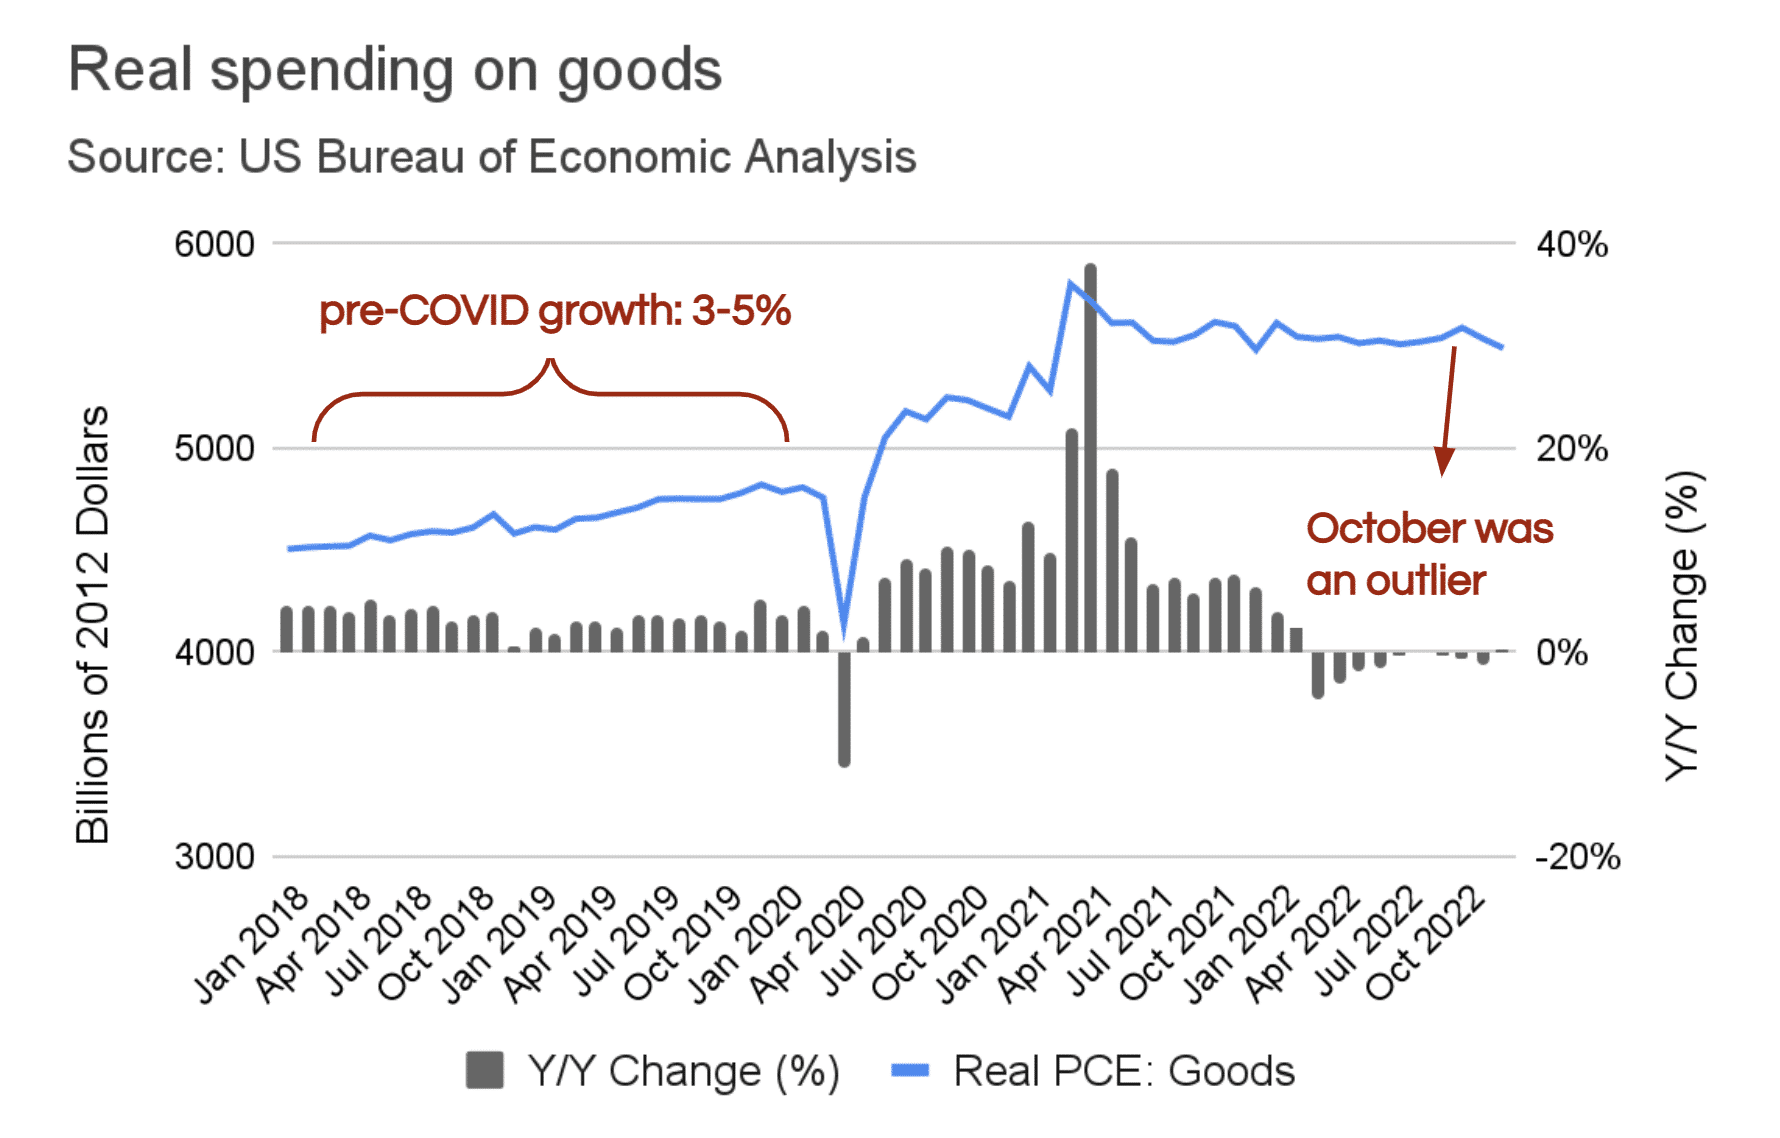
Consumers didn’t buy a lot of goods: real personal consumption expenditures rose by 2.1% on an annual basis in the fourth quarter. However, this increase was mostly driven by services. The growth in goods spending was only 1.1%, significantly below the pre-pandemic range of 3-5%.
Spending on goods lost momentum: the GDP report concealed a declining trend in spending over the course of the quarter. According to data released the following day, personal spending on goods was remarkably high in October, but then declined in the following two months. December saw the lowest level of real spending on goods in 2022.
Imports took a dive: both the imports and exports of goods plummeted in the fourth quarter, by 7% and 4.6% respectively. However, imports are counted negatively in calculating GDP. Therefore, the trade deficit (the difference between exports and imports) has improved over the previous quarter, because imports dropped at a sharper pace than exports (measured in Dollars). While many carriers have started to feel the pain of falling imports, the improvement in net exports contributed to 0.57% of the 2.9% increase in GDP.
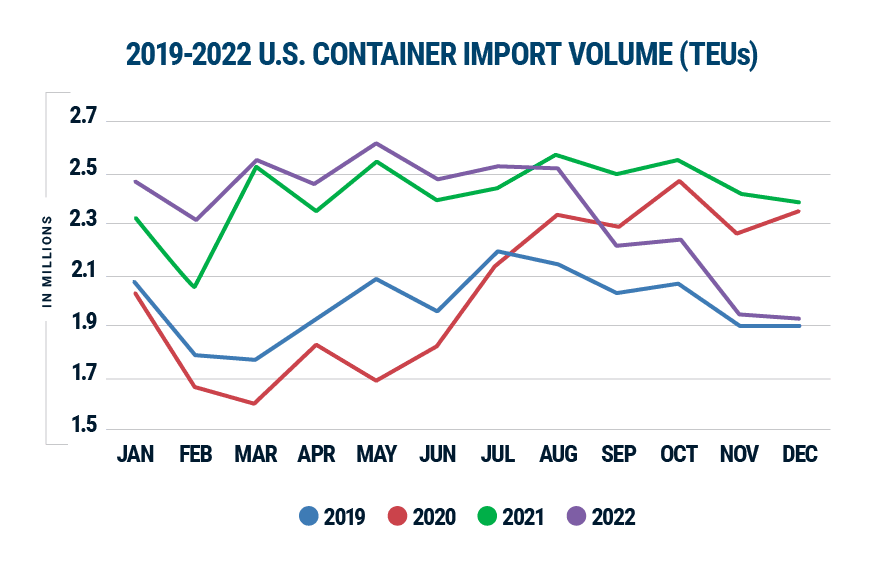
Source: Descartes
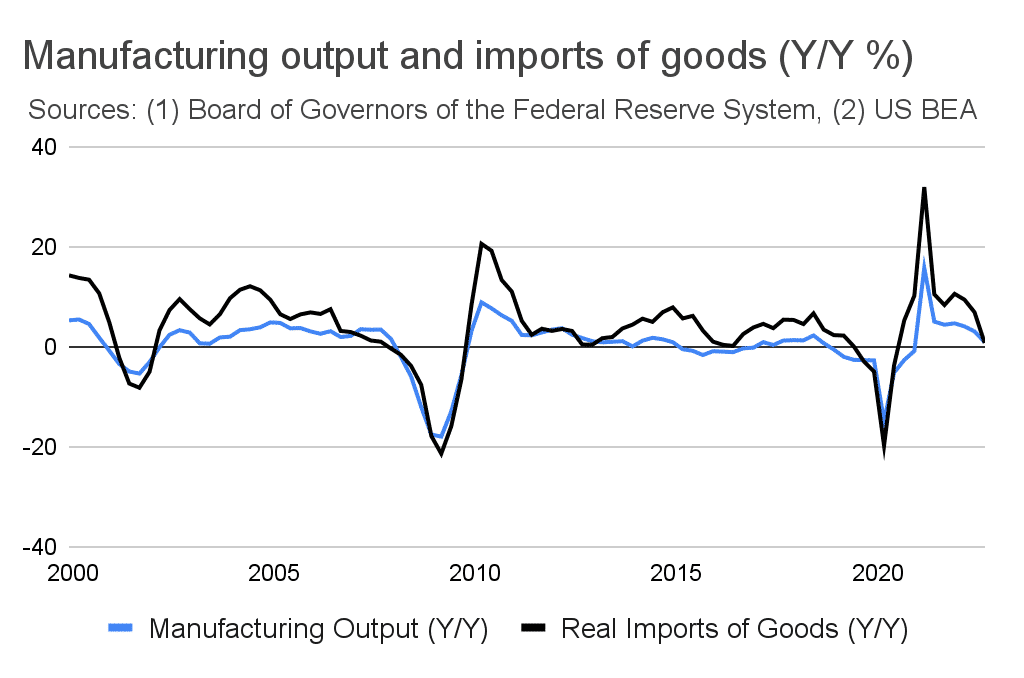
Even though imports constitute a small fraction of US shipments, their effects on the freight economy are substantial. US imports are dominated by capital goods and industrial supplies, which are used by the nation’s factories. Therefore, the decline in imports reflects an overall weakening in the manufacturing economy, which sustains about half of freight demand.
A disadvantage in disguise: the change in private inventories accounts for goods that were produced in the last quarter, but not consumed or used in production yet. Therefore, this counts positively towards GDP. However, the accumulation of inventories is never a good thing for carriers. If retail shelves, wholesale warehouses, and factories are fully stocked, trucks will have to take a break. Unfortunately, the change in private inventories accounted for more than half the growth in annual GDP (1.46%).
In conclusion, GDP is not the best gauge of freight demand. While real GDP grew by 2.9% in the last quarter, the Cass Shipments Index decreased by 3.6% in the same period (indicating less than 1% growth on a seasonally adjusted annual basis). Similarly, the ATA truck tonnage index fell by 1.6% in the fourth quarter, indicating a 6% drop on an annual basis.
Uber Freight enables shippers and carriers to move goods in an optimized and cost-effective way, regardless of market conditions. Technology helps our entire ecosystem absorb shocks when they happen, and our goal is to help shippers and carriers be ready for whatever challenges are ahead and empower them with the most accurate insights to inform decision making for the year ahead.