By: Mudit Gupta, Sr. Data Scientist; Mohit Gulla, Applied Scientist; and Angelo Mancini, Applied Science Manager
Will my load arrive on time?
In the logistics industry, understanding when a load is running late is fundamental to mitigating poor service outcomes. Given advance notice, Uber Freight can work with the carrier and shipper to mitigate the impact of a late arrival. However, late arrivals are frequently detected too late for any adjustments to be made, or not detected until the appointment time has come and gone.
At Uber Freight, our tracking system is designed to provide the highest quality service to shippers. By combining our in-house tracking data with our deep understanding of logistics and our machine learning expertise, we’ve developed a system that continuously refines our data on facility locations and builds on these data to surface real-time predictions of late arrivals to our operations team.
The problem and our approach to solving it
At its core, predicting whether or not a carrier will arrive on-time at a facility requires three key ingredients: (1) the location of the facility, (2) geofences around the facility that we can use to detect when a carrier has arrived at or departed from a facility, and (3) a model that can make real-time predictions of late arrival given a carrier’s location and the location of the facility. As we’ll see in the following example, if any of these components fails, the whole system falls apart.
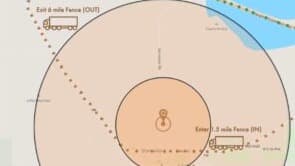
Figure 1: Two trucks headed to the same facility (green pin) generate different types of tracking errors when the system has an inaccurate facility location (the brown circle, with 1.5 mile arrival geofence and 6 mile departure geofence).
In the case of the green truck, neither geofence is triggered, which means that as far as the system can tell, the carrier never arrived at the facility (even though they may actually have arrived on time). In the case of the brown truck, both geofences are triggered
This example motivates the approach we took to building our tracking system: refine the fundamentals (location and geofences) in order to build a high quality late arrival model. Throughout the project, we leveraged the vast amount of historical load and tracking data at our disposal.
Step 1: Laying the foundation with Project Pinpoint
Getting location data for shipping facilities sounds straightforward, right? After all, it’s the trucks that are moving, not the facilities. Unfortunately, it’s not that simple. When we reviewed our facility location data at the beginning of our project, we found that the locations we’d been getting from legacy GPS navigation companies were frequently incorrect. For a sample of 500 of the largest facilities in our network, ~40% had incorrect GPS locations, including 10% of cases where the facility’s location was off by at least 0.3 miles (most likely mapped to the center of the facility’s postal code). 0.3 miles may not seem like a sizable error, but for these facilities, our data indicated that ~24% of loads had incorrect arrival/departure times logged by the system.
We turned to our internal GPS tracking data, which we collect through the Uber Freight mobile carrier app for thousands of shipments on a daily basis. Figure 2 below illustrates our approach.
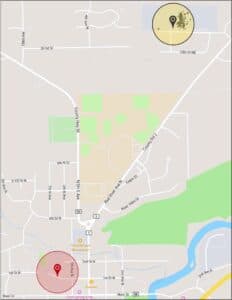
Figure 2: The facility location in the system (red circle) is incorrect; the correct location can be identified by analyzing the location of GPS pings for carriers visiting the facility.
It’s clear from this example that the system’s facility location is incorrect, and that the facility is actually located near the cluster of pings at the top right. However, doing this analysis manually for every facility simply isn’t feasible given the scale of our network. Instead, we built a machine learning model to analyze our historical GPS data and identify clusters of pings associated with facilities. To ensure the accuracy of the algorithm, we added common sense checks like distinguishing between pings received from carriers that were moving versus those that were at rest; discarding clusters associated with rest stops, fuel stops and other spurious locations; and ruling out GPS signals from dispatchers that were not actually in transit.
After cleaning our historical facility location data, we now run the Pinpoint algorithm on a recurring basis to make sure that our facility locations are always up to date, and that we identify locations for new facilities joining our network as quickly as possible.
Step 2: Building better geofences with Project Lasso
As we discussed in the first example, Uber Freight’s automated tracking system (and many tracking systems in the freight industry) uses geofences to determine the time a carrier arrives at and departs from a facility. There are several challenges when trying to draw ‘good’ geofences:
Geofences that are too large can lead to inaccurate arrival/departure events, while fences that are too small may miss actual arrivals and departures.
There’s no single best radius for a geofence since facilities vary widely by size: some facilities are small/single buildings, while a superstore or major distribution center could have one address and ‘location’ tied to a complex of buildings and a spacious parking lot, none of which represent the actual loading dock.
If the facility is shared by multiple shippers, then we may need to shift the location of the geofence to focus on the area of the facility relevant to the load being tracked.
To address these challenges, we again turned to our high-quality, in-house GPS data. In Project Lasso we developed an algorithm that analyzes hundreds of thousands of GPS signals to automatically create tailored geofence for our facilities. Whereas the standard geofence is a circle with a 1.5 mile radius, we’ve been able to produce geofences with radii as small as 0.1-0.3 miles around the facility or loading dock within the facility. Figures 3 and 4 below show how we converted GPS data into genfeces for a variety of facilities.
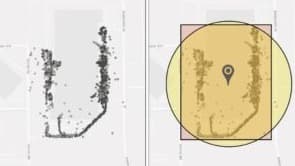
Figure 3: (Left) Raw GPS pings for carriers visiting the facility; (Right) Facility location and geofence automatically derived from GPS pings.
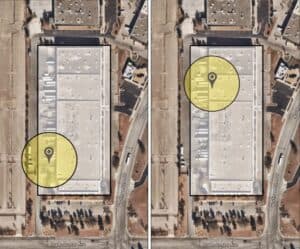
Figure 4: Two different locations and geofences identified at the same facility but connected to different shippers.
Project Lasso has helped both shippers and carriers save time by reducing disputes about arrival and departure times. We have also seen a 60% (relative) reduction in the fraction of loads exhibiting some type of obviously incorrect behavior, i.e. dwell defects in which a carrier seems to have spent
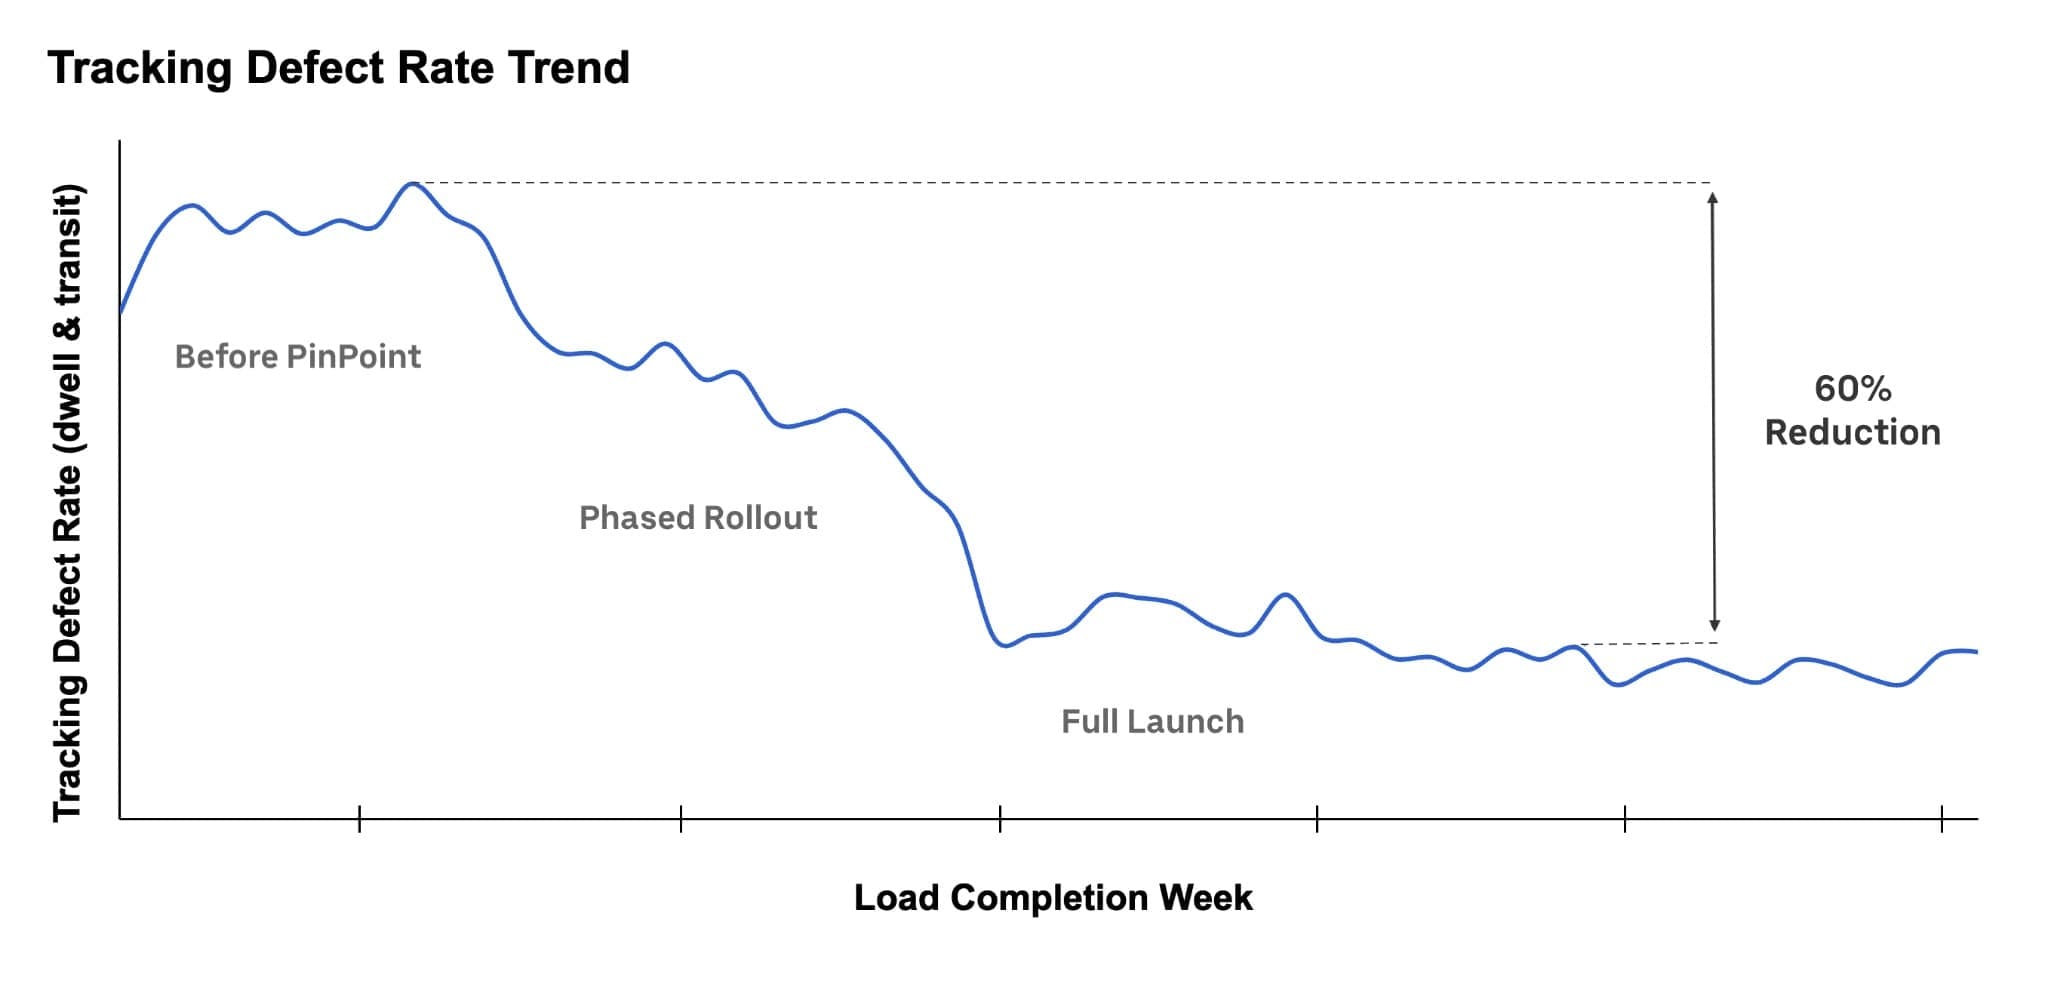
Figure 5: Project Lasso drove a sustained 60% (relative) reduction in tracking defect rates after full launch.
3: Predicting late arrivals with machine learning
After firming up the foundations of our system by correcting facility locations and building tailored geofences, we were ready to tackle our original challenge: providing high quality, real-time late arrival predictions at scale. We followed a four-step process:
We used the newly-corrected facility locations and geofences to
We then curated the historical loads in our data to make sure that only those loads for which we had sufficiently high quality GPS tracking data available were included, again to help the model learn from the highest quality data.
Next, we enriched the data available to the model; in addition to a carrier’s position, we included information such as the carrier’s direction of travel, speed, pacing, etc., as well as their historical on-time performance.
Finally, we trained and tuned our model using our in-house data science platform, obtaining a model that could predict risk of late arrival starting at six hours in advance of pick-up.
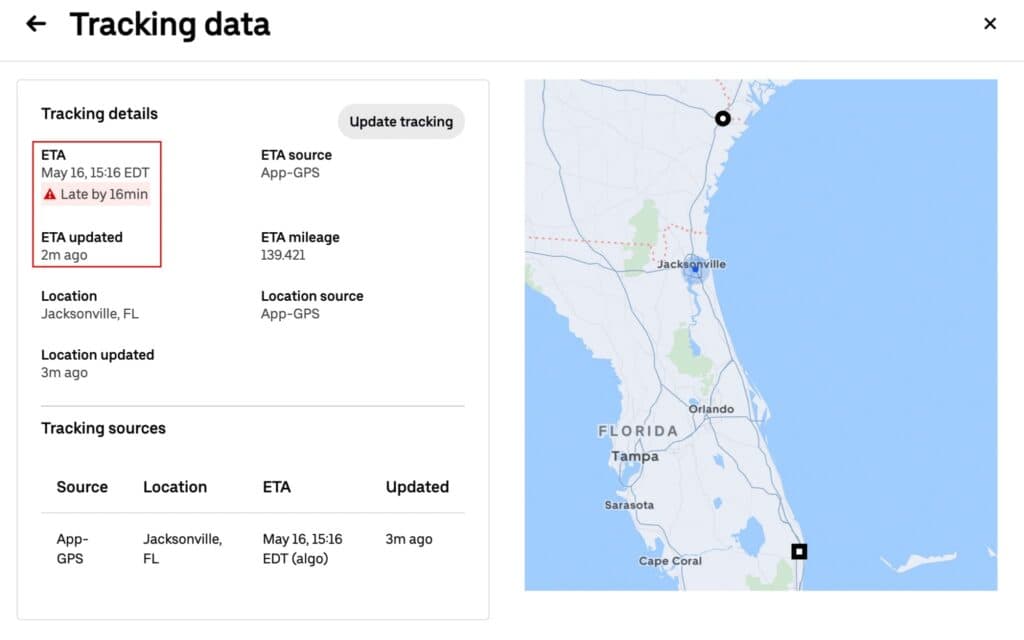
With these predictions in hand, our operations team can focus their attention on loads likely to arrive late and take mitigating steps such as reaching out to the carrier to check in, alerting the shipper so they can extend or reschedule the appointment, or reassigning the load to a different carrier (also known as ‘bouncing’ the load). Since launching the probability of late arrival (PLA) model in production, we’ve seen a significant improvement both in our ability to flag late loads as well as detect bounced loads.
What’s next
We view the late-arrival machine learning project discussed here as the first step in an ambitious roadmap to improve service outcomes for our shippers. We are actively working on an estimated-time-to-arrival (ETA) model to accompany our PLA model. ETA modeling is ubiquitous in the consumer and retail space (we’ve all used a navigation app or seen ETAs for food deliveries), but ETA prediction for freight poses distinct challenges. For instance, freight trips often last much longer than food delivery or rideshare trips, cross through multiple geographies with different traffic and weather conditions, and are impacted by both regulations on hours-of-service and carrier behavior (e.g. stopping to sleep, refuel, etc.).
With PLA and ETA models in place, we will develop automated ‘self-healing’ workflows to further improve service for our shippers. For instance, we can use the PLA model to flag loads at risk of arriving late to pick-up, then use the ETA and PLA models to identify which carriers nearby might be able to pick up the load in time, and finally automatically ask the most promising carriers if they can step in to avoid a missed appointment. We are also leveraging the foundations developed in the late-arrival project to go beyond load-level tracking for shippers. For instance, using the improved arrival and departure times generated by Projects Pinpoint and Lasso, we have produced much more accurate estimates of how long carriers spend waiting at facilities (‘dwell time’) and have combined those estimates with our in-house carrier ratings data to quantify the impact of poorly operated shipper facilities on carrier satisfaction and, ultimately, shipper costs.